Street Grid
“We stop stuffing ourselves with the new and start cannibalizing the old. Our system begins by consuming unwanted building garbage. We will dumpster dive to make a future, superior architecture. Because int the future, one building’s trash is another building’s architecture”
– Brandon Cliford, “The Cannibal’s Cookbook”
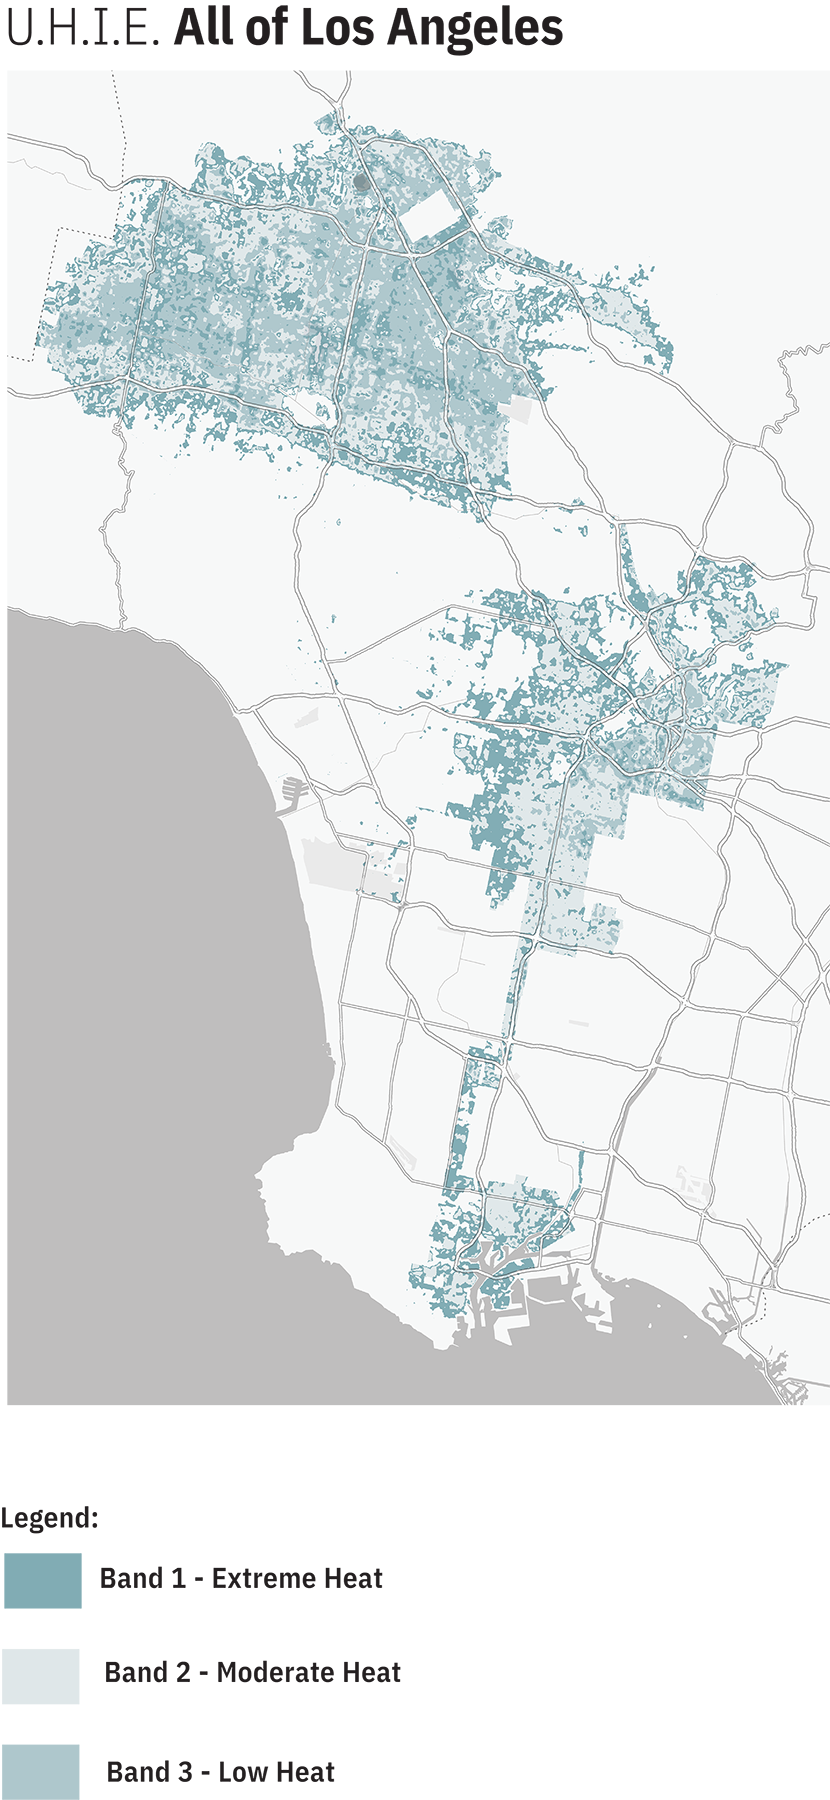
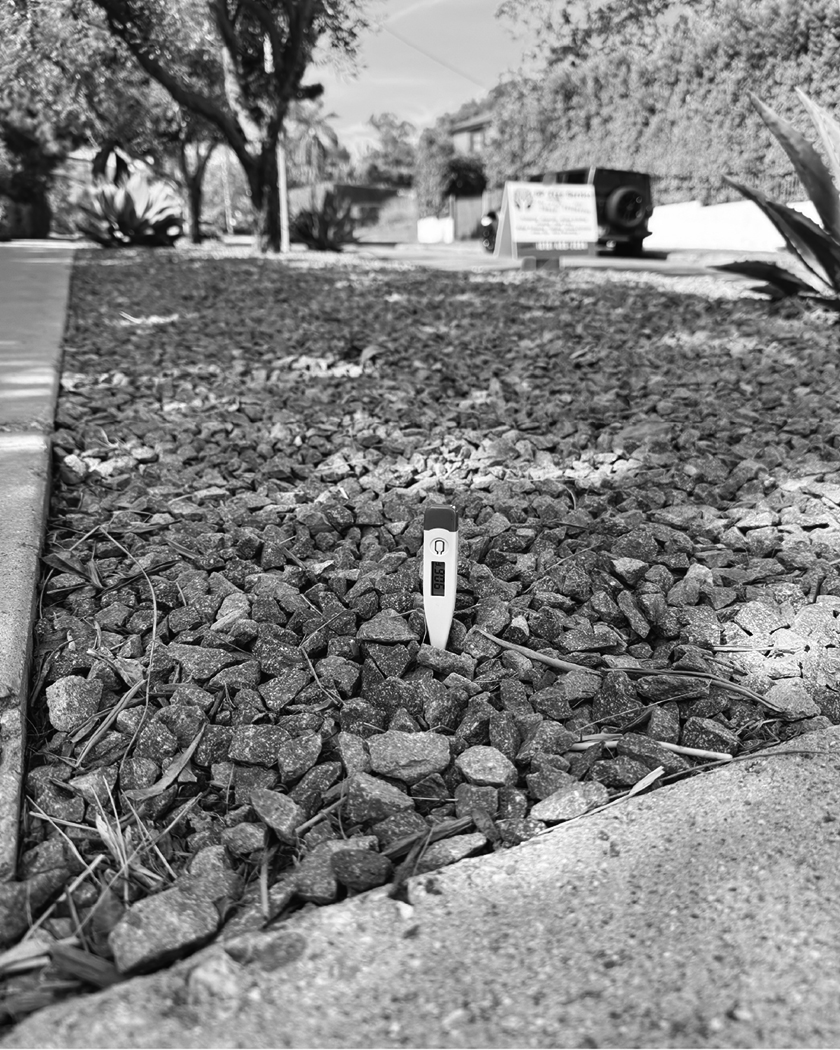
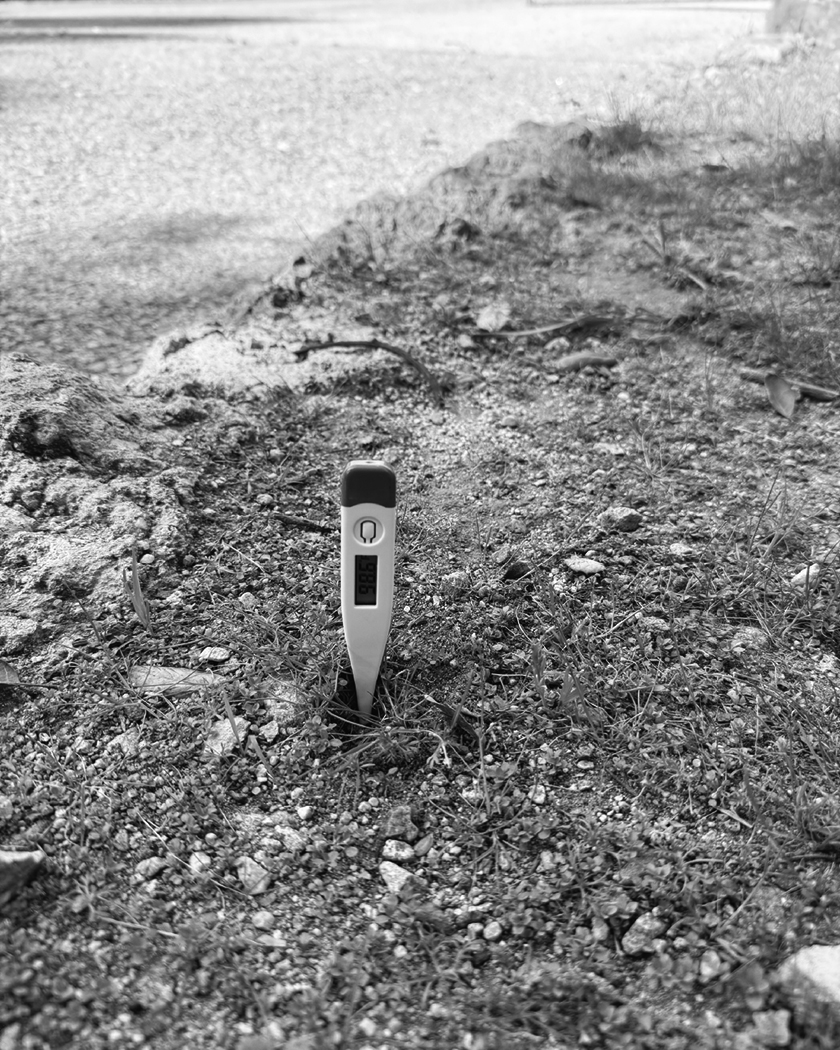
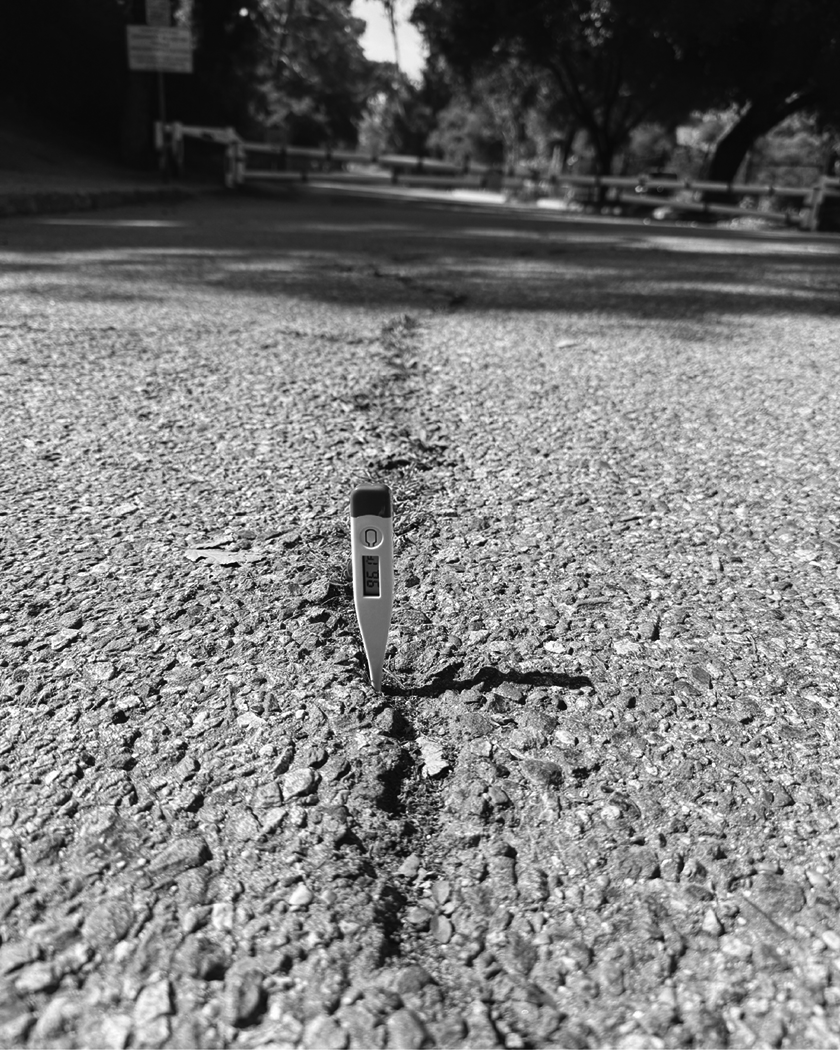
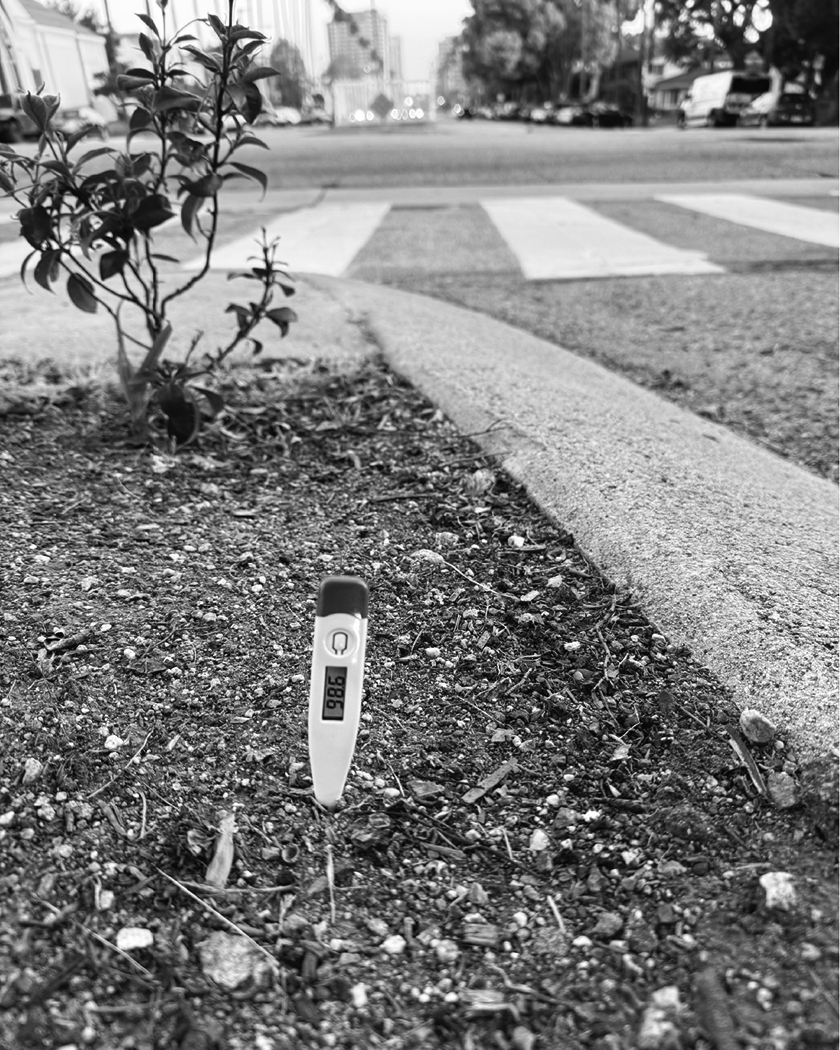
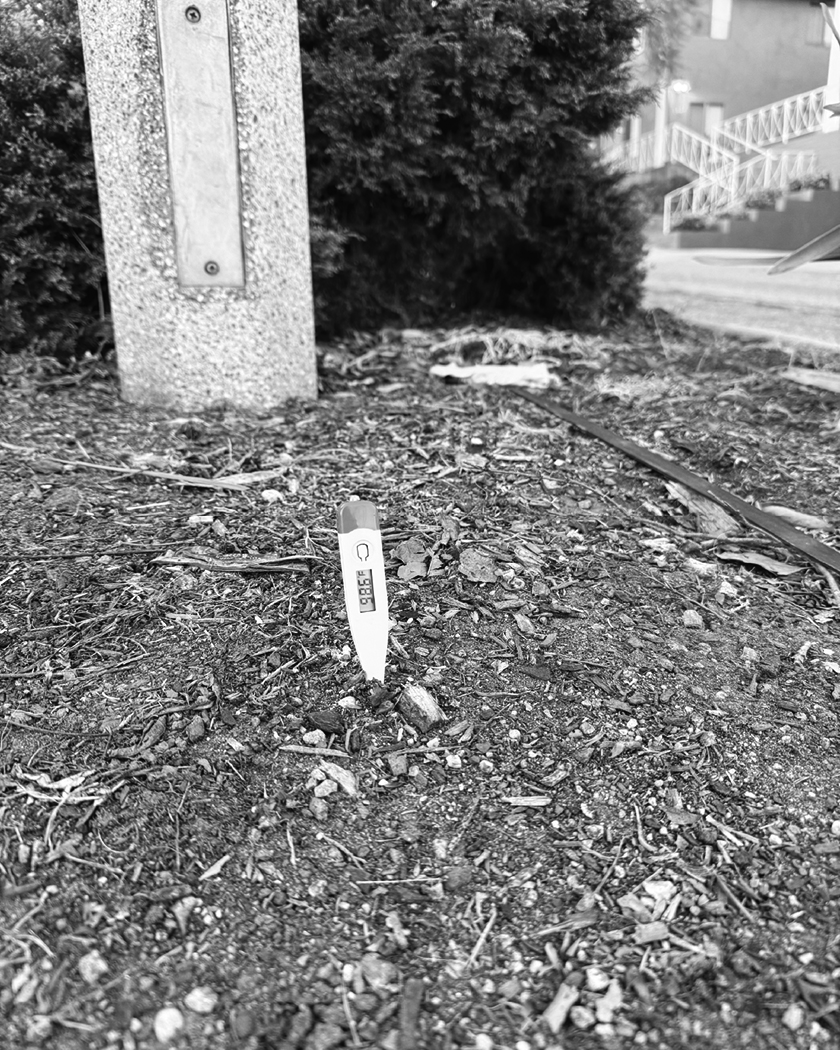
In many cities, concrete, asphalt, and steel dominate the landscape—absorbing and radiating heat, creating what scientists call Urban Heat Islands (UHIs). In places like Los Angeles, these heat islands can make the city up to six degrees hotter than the surrounding desert. This temperature difference is not just uncomfortable; it’s deadly. Each summer, extreme heat claims the lives of 60 to 70 Angelenos, often without being recognized as the primary cause. Vulnerable communities—especially low-income residents and people of color—bear the brunt of these impacts, living in neighborhoods with the highest heat exposure and the fewest resources to cope.
The root causes of UHIs include reduced natural landscapes, heat-absorbing urban materials, and waste heat from vehicles, air conditioning units, and industrial facilities. Surfaces like rooftops and roadways can become dramatically hotter than the air around them, with temperatures soaring as much as 66°F higher during the day. These elevated temperatures increase energy use, strain infrastructure, and worsen public health outcomes.
Addressing UHIs is not just an environmental challenge—it’s a public health priority. This project will examine how urban design contributes to heat risk, which neighborhoods are most affected, and what interventions—like adding shade, planting trees, or rethinking building materials—can cool our cities and protect our communities.
1781
The roads angle toward the northeast. This tilted layout dates back to Los Angeles’ beginnings as a Spanish colonial outpost. As Jeremy Rosenberg noted for KCET Departures, when Felipe de Neve established the town, he followed the Laws of the Indies, which required that a city’s central plaza—the hub of social and political life—be aligned 45 degrees off the cardinal points. (4)
1849
After the U.S. took control of Los Angeles in 1847, one of their priorities was to apply American mapping standards to the existing Hispanic layout, paving the way for privatizing land. U.S. Army engineer E.O. Ord conducted the first survey, laying out a grid of city blocks angled 36 degrees south from the plaza. His map—the first of Los Angeles— shaped the development of downtown and embedded what D.J. Waldie calls the city’s “crooked heart” into its urban form. (3)
1857
By 1853, the newly American city of Los Angeles was deep in debt and turned to converting more public land into private property to raise funds. Some parcels were sold outright, starting at just a dollar per acre. Others were given away with the condition that recipients make improvements—such as digging irrigation ditches or planting crops—so the city could later benefit from higher tax revenues on these “donation lots.” (1)
1857
Where Wilshire crosses the Harbor Freeway, it meets a shift in the street grid—this one tilted 28 degrees north, following the work of surveyor Henry Hancock. Unlike E.O. Ord, who focused only on settled areas, Hancock mapped all 16 square leagues originally granted to the pueblo by King Charles III in 1781. Most of this land was still unoccupied, so Hancock divided it into square tracts. As these tracts were sold, streets were built along the property lines, and many of Hancock’s divisions—like Rampart Boulevard and Alvarado Street—remain as roads today. (4)
1873
Street Car railroads began to get built (2)
1896
A city commission aimed to organize the chaotic street grid of Northeast Los Angeles, where many streets shared duplicate names. Since 1849, L.A. had used numbered streets, and the sequence had recently expanded south. The commission proposed a matching set of numbered “avenues” north of the old Spanish plaza, replacing many original street names. (1)
1990
The Metro Rail system launches and expands with lines the Blue Line. Streets and neighborhoods are reshaped to accommodate rail corridors, stations, and transit-oriented development (TOD), influencing how streets function and connect. (5)
1993
The Metro Rail system launches and expands with lines the Red Line. Streets and neighborhoods are reshaped to accommodate rail corridors, stations, and transit-oriented development (TOD), influencing how streets function and connect. (5)
1995
The Metro Rail system launches and expands with lines the Green Line. Streets and neighborhoods are reshaped to accommodate rail corridors, stations, and transit-oriented development (TOD), influencing how streets function and connect. (5)
2008
Measure R Passed. Voters approve Measure R, a half-cent sales tax for transportation projects. Funds major expansions to the transit system, including the Crenshaw Line, Purple Line extension, and Regional Connector—reshaping street infrastructure to support new transit routes. (7)
2016
Measure M Passed. Voters approve Measure M, another major sales tax for transit and infrastructure. Funds even more street redesigns and transit buildout, including road diets (reducing lanes), bike lane installations, and support for bus rapid transit (BRT) projects. (6)
INFRASTRUCTURE
WEIGHT
- Effect renders this concrete jungle almost six degrees hotter than the surrounding desert. (13)
- This city heat is a growing public health threat. Heat kills 60 to 70 Angelenos every summer, according to University of Miami climatologist Larry Kalkstein. But even though heat causes more deaths and medical problems than most other natural disasters, it’s rarely identified as the culprit. (13)
- In general, people of color…in urban areas are more likely to live in high heat island risk neighborhoods compared to their white counterparts. (13)
- Risks are higher in Pacoima and the San Fernando Valley, Palmdale, Lancaster, and east Los Angeles County. But in places like Norwalk and South L.A., more ER visits may raise questions about where city officials should concentrate communication efforts, which neighborhoods need cooling centers, and what makes health problems worse for Angelenos. (13)
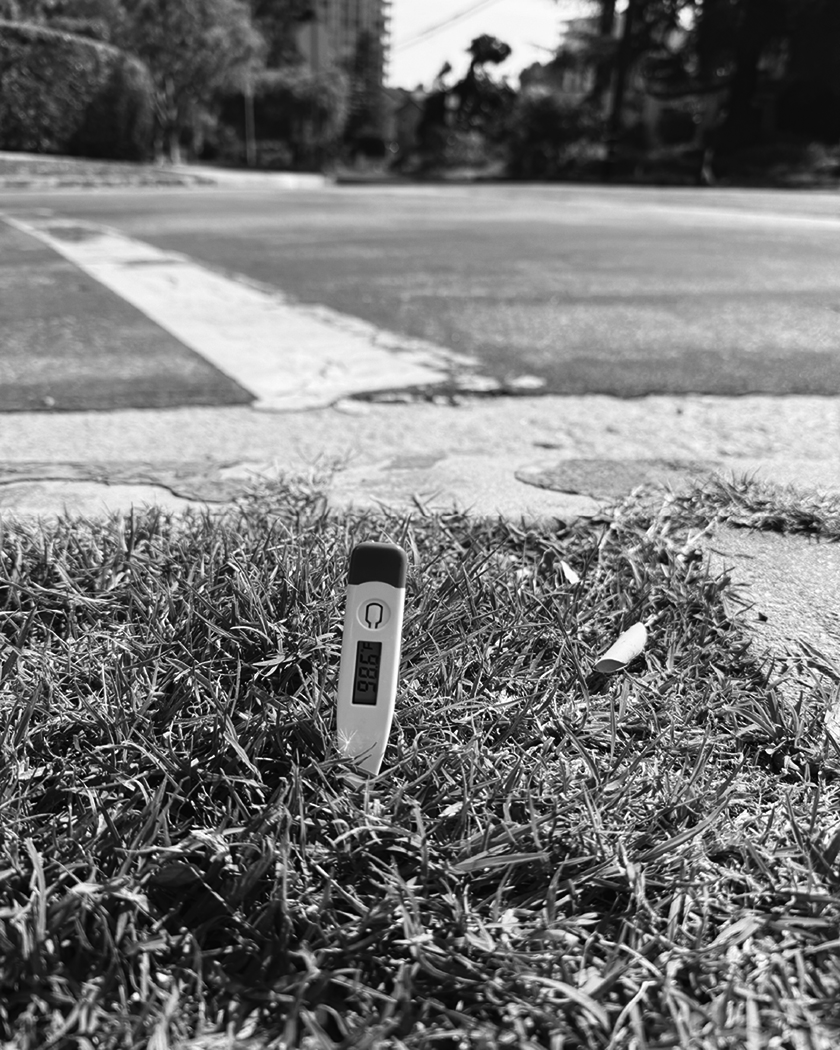
- Grass and asphalt, bouncy rubber or artificial turf – changes heat exposure. Little micro-climates that are almost like tiny little heat islands within the heat island of the greater urban area. So shade is important. (14)
U.H.I.E.
INFORMATION
Structures such as buildings, roads, and other infrastructure absorb and re-emit the sun’s heat more than natural landscapes such as forests and water bodies. Urban areas, where these structures are highly concentrated and greenery is limited, become “islands” of higher temperatures relative to outlying areas. These pockets of heat are referred to as “heat islands.” Heat islands can form under a variety of conditions, including during the day or night, in small or large cities, in suburban areas, in northern or southern climates, and in any season.
Causes of Urban Heat Islands
Reduced Natural Landscapes in Urban Areas. Trees, vegetation, and waterbodies tend to cool the air by providing shade, transpiring water from plant leaves, and evaporating surface water, respectively. Hard, dry surfaces in urban areas – such as roofs, sidewalks, roads, buildings, and parking lots – provide less shade and moisture than natural landscapes and therefore contribute to higher temperatures. (15)
Urban Material Properties
Conventional human-made materials used in urban environments such as pavements or roofing tend to reflect less solar energy and absorb and emit more of the sun’s heat compared to trees, vegetation, and other natural surfaces. Often, heat islands build throughout the day and become more pronounced after sunset due to the slow release of heat from urban materials. (15)
Heat Generated from Human Activities
Vehicles, air-conditioning units, buildings, and industrial facilities all emit heat into the urban environment. These sources of human-generated, or anthropogenic, waste heat can contribute to heat island effects. (15)
Surface Heat Islands
These heat islands form because urban surfaces such as roadways and rooftops absorb and emit heat to a greater extent than most natural surfaces. On a warm day, conventional roofing materials may reach as much as 66°F warmer than the surrounding air temperatures. Surface heat islands tend to be most intense during the day when the sun is shining. (15)
IMPACT OF
URBAN HEAT ISLANDS
Increased Energy Consumption
Heat islands increase electricity demand for air conditioning and peak energy demand. Increased electricity demand for air conditioning ranges from 1–9% for each 2°F increase in temperature, with the highest increase in countries where most buildings have air conditioning, such as the United States. This increased demand contributes to higher electricity expenses. Peak demand generally occurs on exceptionally hot afternoons, when offices and homes are running air-conditioning systems, lights, and appliances. This increased demand can overload systems and require a utility to institute controlled brownouts or blackouts to avoid power outages. (16)
U.H.I.E.
Weight of Material Per Mile
Volume = Length x Width x Thickness
Boulevard I: 1 mile (5280) x 100’ x 0.667 (8”) = 353,760 cubic feet
(1 Cubic Yard = 27 Cubic Feet)
353,760 / 27 = 13,103 Cubic Yards
Additional 10% for Waste Factor
13,103 x 1.1 = 14,413 Cubic Yards of Concrete Would be Needed
Weight: (1 Cubic Yard of Concrete is about 4,000 Pouds or 2 Tons)
14,413 x 4,000 = 57,652,000
In Tons: 57,652,000 / 2,000 = 28,826 Tons of Concrete
Avenue I: 1 mile (5280) x 70’ x 0.667 (8”) = 246.489.6 cubic feet
(1 Cubic Yard = 27 Cubic Feet)
246,489.6 / 27 = 9,129.2 Cubic Yards
Additional 10% for Waste Factor
9,129.2 x 1.1 = 10,042,12 Cubic Yards of Concrete Would be Needed
Weight: (1 Cubic Yard of Concrete is about 4,000 Pouds or 2 Tons)
10,042.12 x 4,000 = 40,168,480
In Tons: 40,168,480 / 2,000 = 20,084.24 Tons of Concrete
Local Street: 1 mile (5280) x 36’ x 0.667 (8”) = 126,854.4 cubic feet
(1 Cubic Yard = 27 Cubic Feet)
126,854.4 / 27 = 4,698.31Cubic Yards
Additional 10% for Waste Factor
4,698.31 x 1.1 = 5,168.142 Cubic Yards of Concrete Would be Needed
Weight: (1 Cubic Yard of Concrete is about 4,000 Pouds or 2 Tons)
5,168.142 x 4,000 = 20,672.568.9
In Tons: 20,672.568.9 / 2,000 = 10,336.2844 Tons of Concrete
U.H.I.E.
Weight of Material for all of LA County
22,000 Miles of LA County Roads
22,000 miles × 5,280 feet per mile = 116,160,000 feet of road
Volume per mile of road = Length × Width × Thickness
Volume per mile = 5,280 × 40 × 0.5 = 105,600 cubic feet per mile
Volume per mile = 5,280×40×0.5 = 105,600 cubic feet per mile
Total Volume = 116,160,000 × 5,280 / 40 × 0.5 = 11,616,000 cubic feet
Total Volume in Cubic Yards = 11,616,000 / 27 ≈ 430,666.7 cubic yards
Total Weight in Pounds = 11,616,000 cubic feet × 150 pounds per cubic foot
Total Weight in Pounds = 1,742,400,000 pounds
Total Weight in Tons = 1,742,400,000 / 2,000 = 871,200 tons
U.H.I.E.
Street Types
Boulevards – Represent the City’s widest streets that typically provide regional access to major destinations.
Boulevards I – Typical Number of Lanes: 3-4 lanes in each direction. Target Operation Speed: 35 mph
Boulevards II – Typical Number of Lanes: 2-3 lanes in each direction. Target Operation Speed: 35 mph
Avenues – Vary in their land use context, with some streets passing through both residential and commercial areas.
Avenue I – Typical Number of Lanes: 1-2 lanes in each direction. Target Operation Speed: 35 mph
Avenue II – Typical Number of Lanes: 1-2 lanes in each direction. Target Operation Speed: 30 mph
Collector Steets – Are generally located in residential neighborhoods. They provide linkages between local streets and arterials and are not intended for cut-through traffic.
CS – Typical Number of Lanes: 1 lane in each direction. Target Operation Speed: 25 mph
Local Streets – Have one lane in each direction, include parking on both sides of the street, and are intended to accommodate areas with lower volumes of vehicular traffic.
LS – Typical Number of Lanes: 1 lane in each direction. Target Operation Speed: 20 mph
Street Grid Proposals
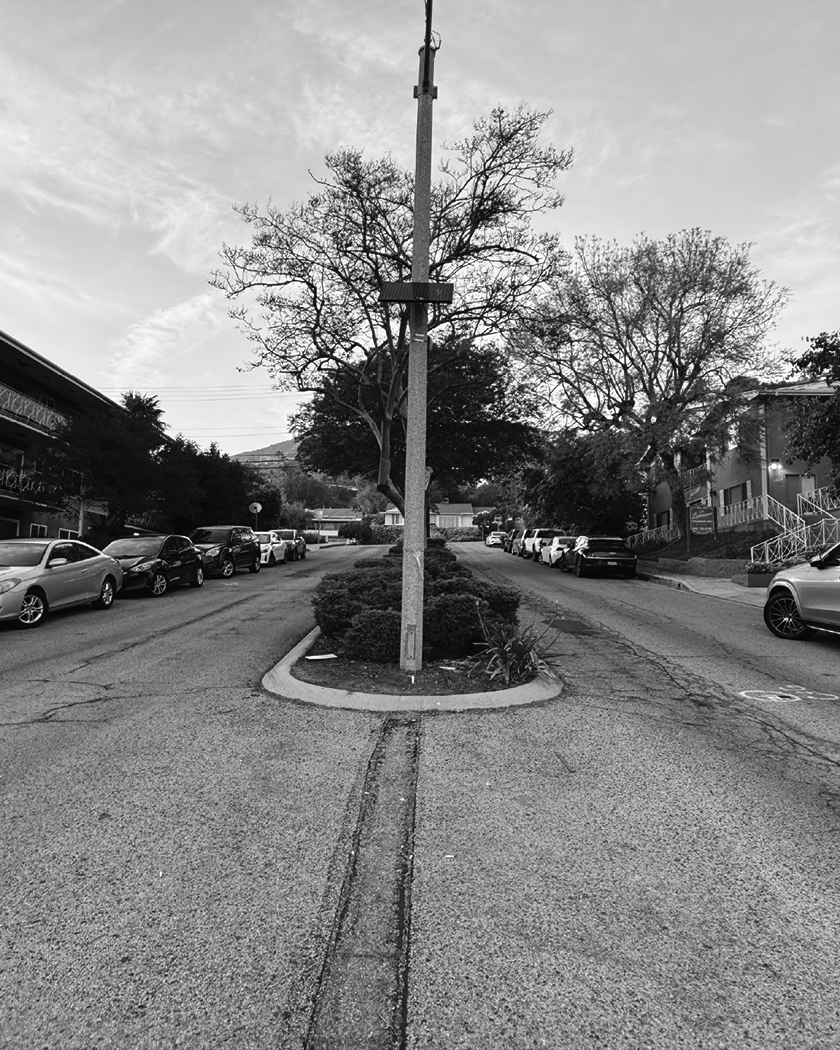
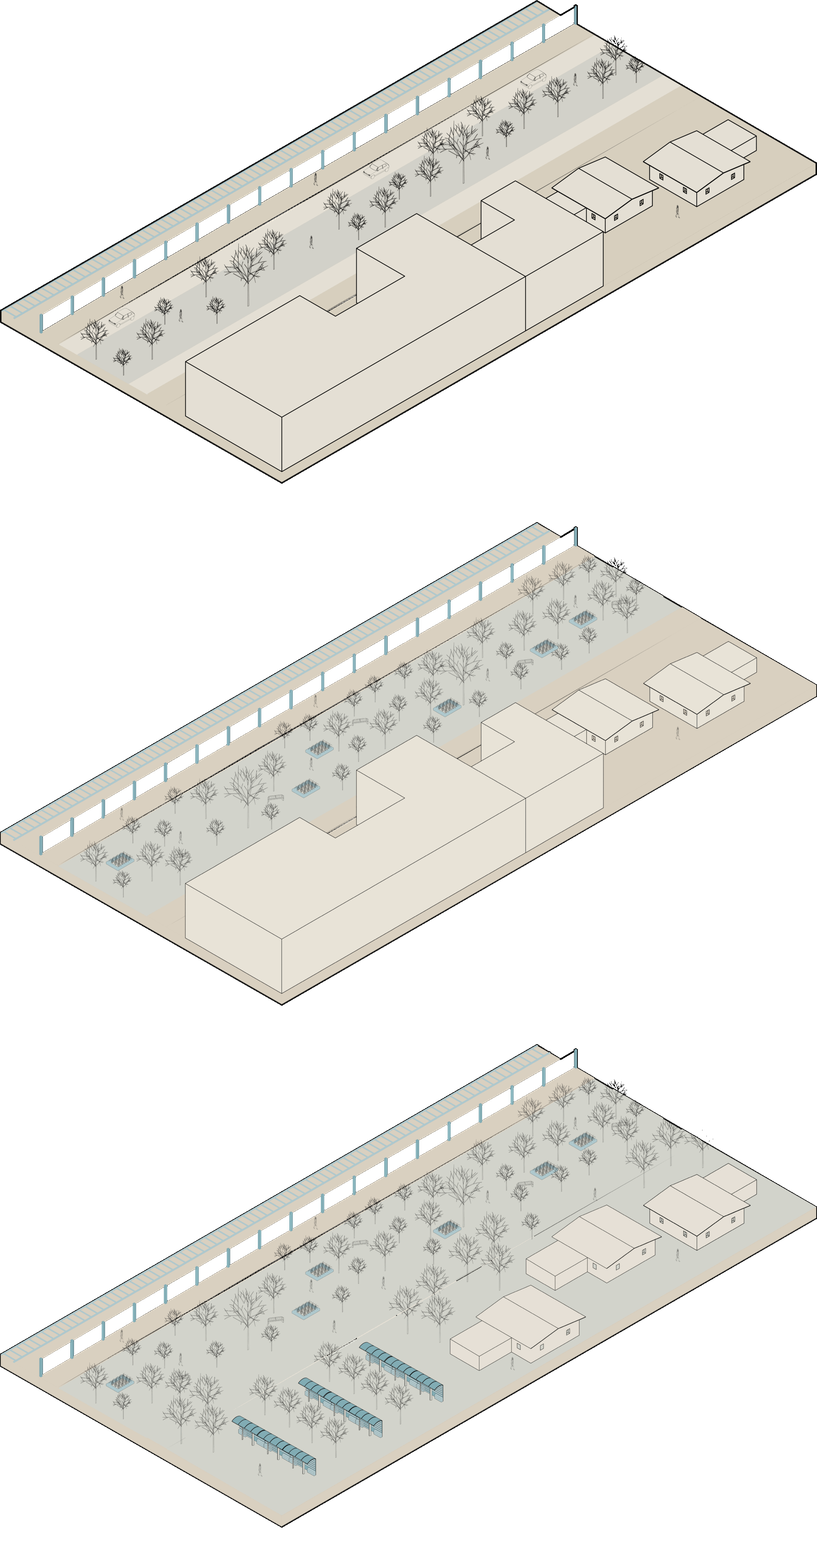
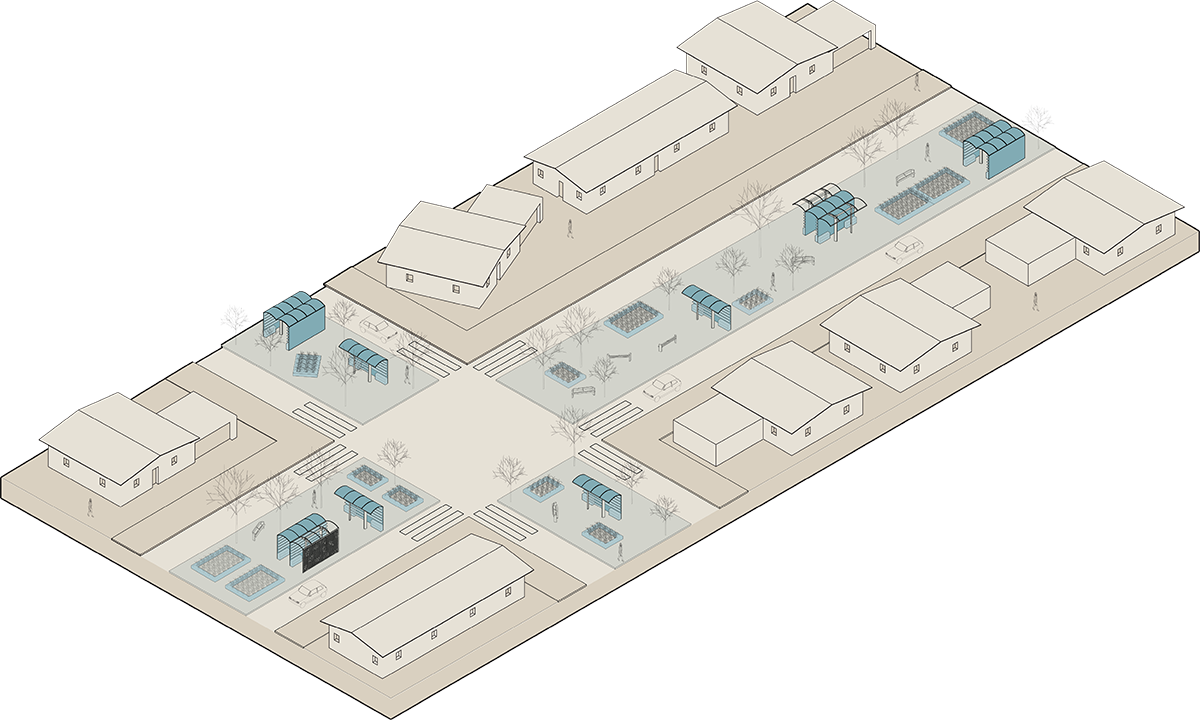
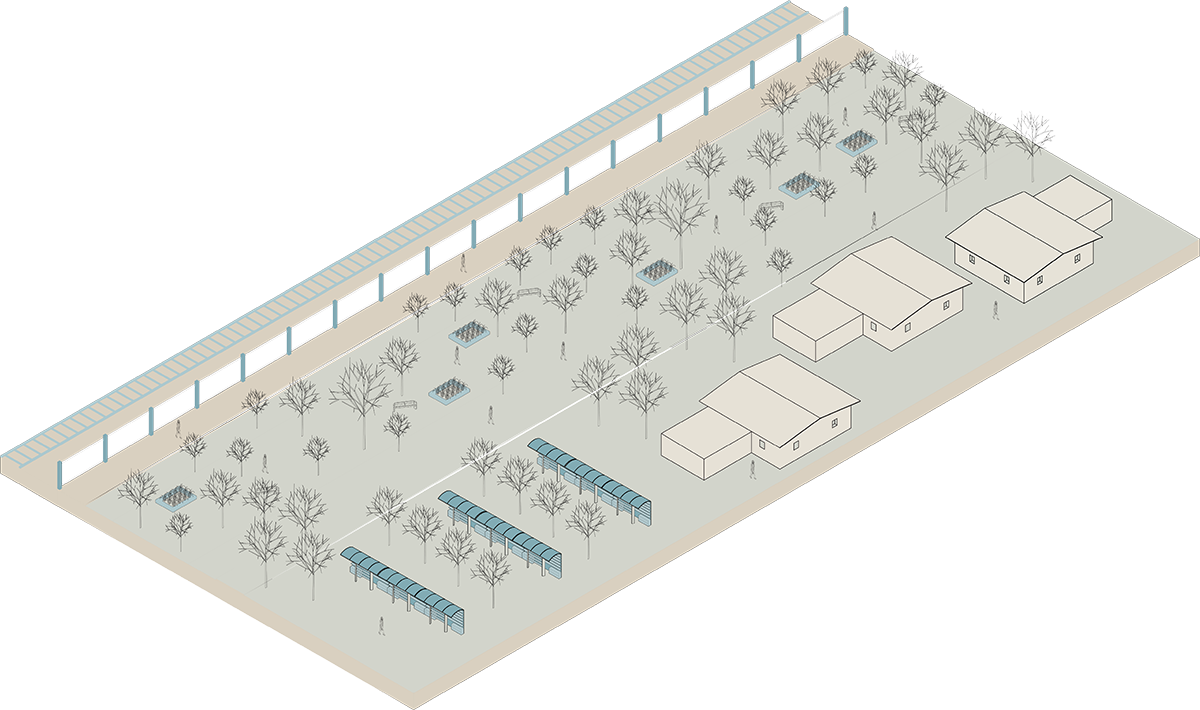
This design proposal focuses on doing all that is needed to reduce the Urban Heat Island Effect one block at a time. Shade and cool down streets are what is needed to reduce the heat, and this design provides just that. Starting from the first step, roads with vehicle access and multiple lanes are used, meaning that the median of a 4 way or 2-way intersection is taken and gotten its concrete striped away. After the concrete is gone from the median, grass is planted in its place making the median a non-drivable grass median. After that comes the step towards community involvement and giving back to the community the bus stops that are now toolshed.
PROPOSAL
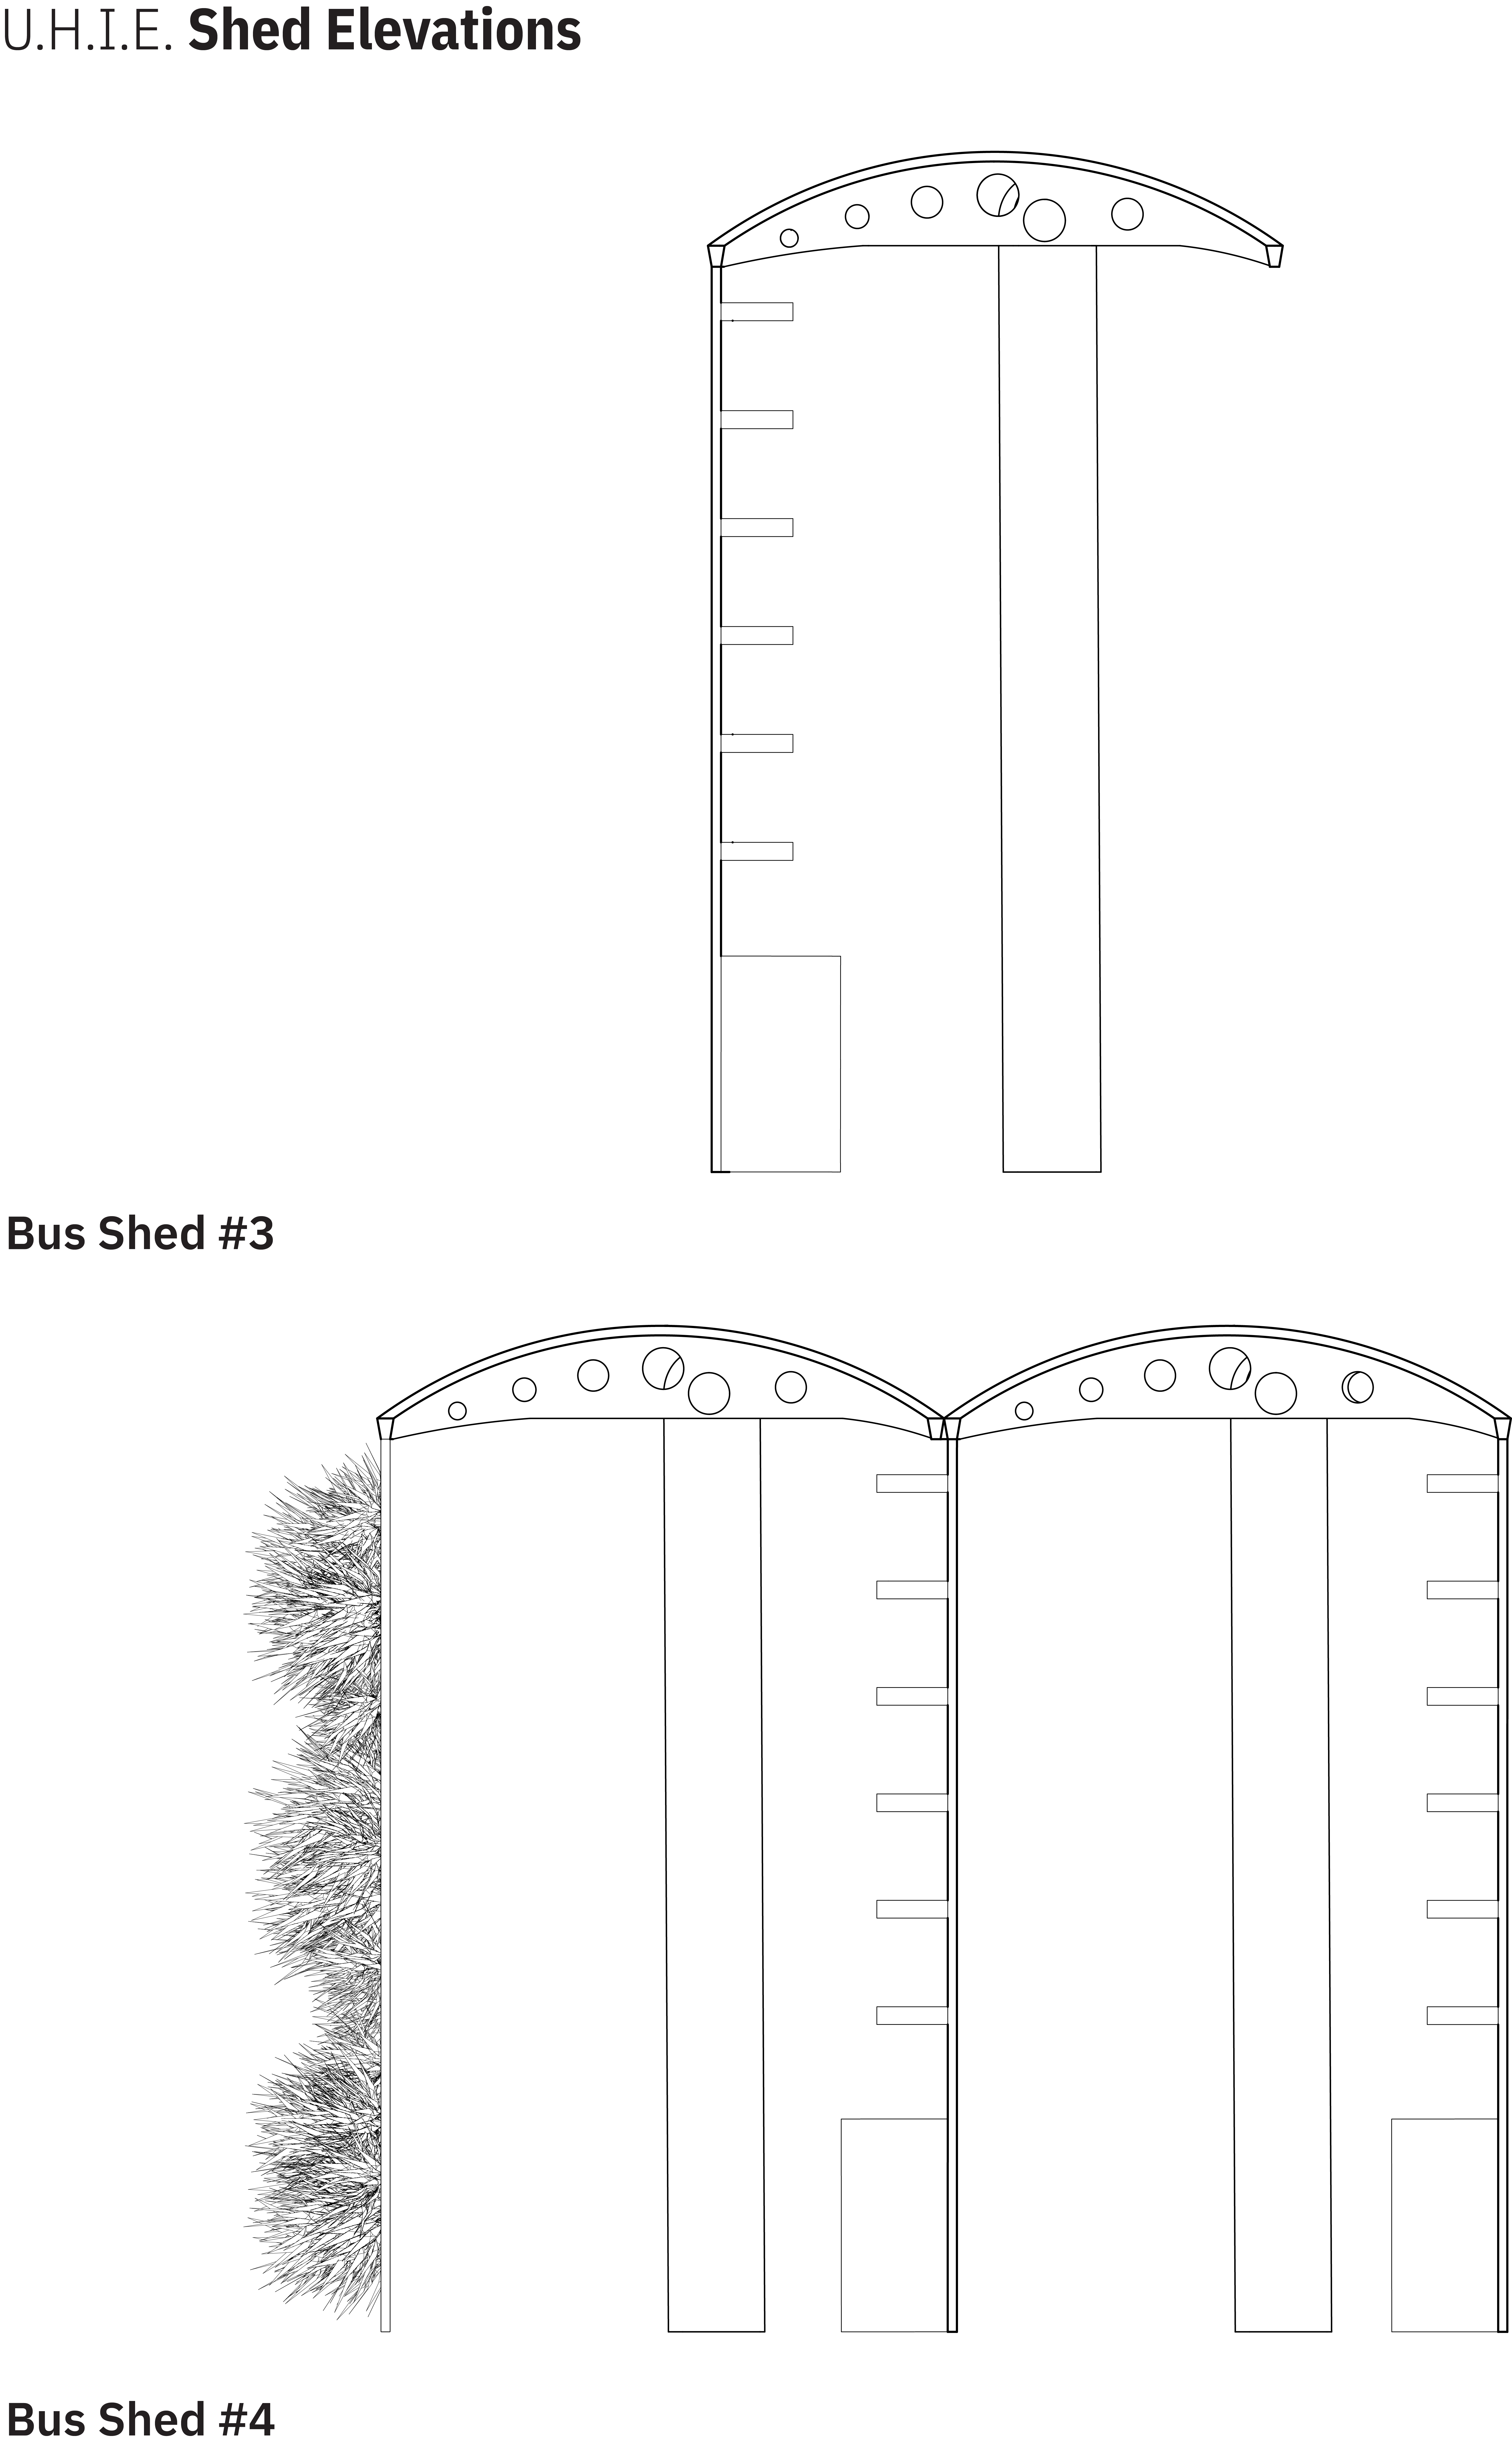
SHED BUS STOPS
These tools act like a library for tools meaning the community can come and borrow gardening tools to plant their own gardens with fruits, plants, and many other greeneries to further assist in the reduction of heat from the streets. These sheds are placed throughout the neighborhood on the grass median coming in a hand full of designs. These steps not only assist in the reduction of heat but also bring communities together. As it is a shared space, the design is set in a way where community gatherings are encouraged to take away from what the street grid originally did which was almost a separation border between neighbors and neighborhoods.
U.H.I.E.
CHOSEN SITE #1
U.H.I.E Bands
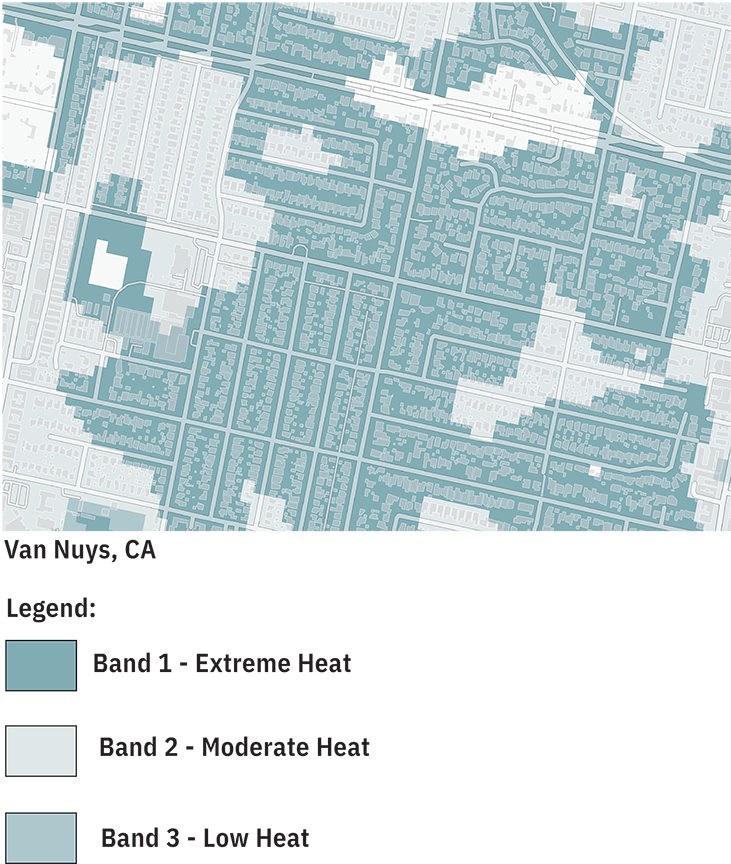
The map shows how a section of Van Nuys is affected heavily by the Urban Heat Island Effect as majority of the city is in Band 1 and Band 2.
Potential Based on Existing Features
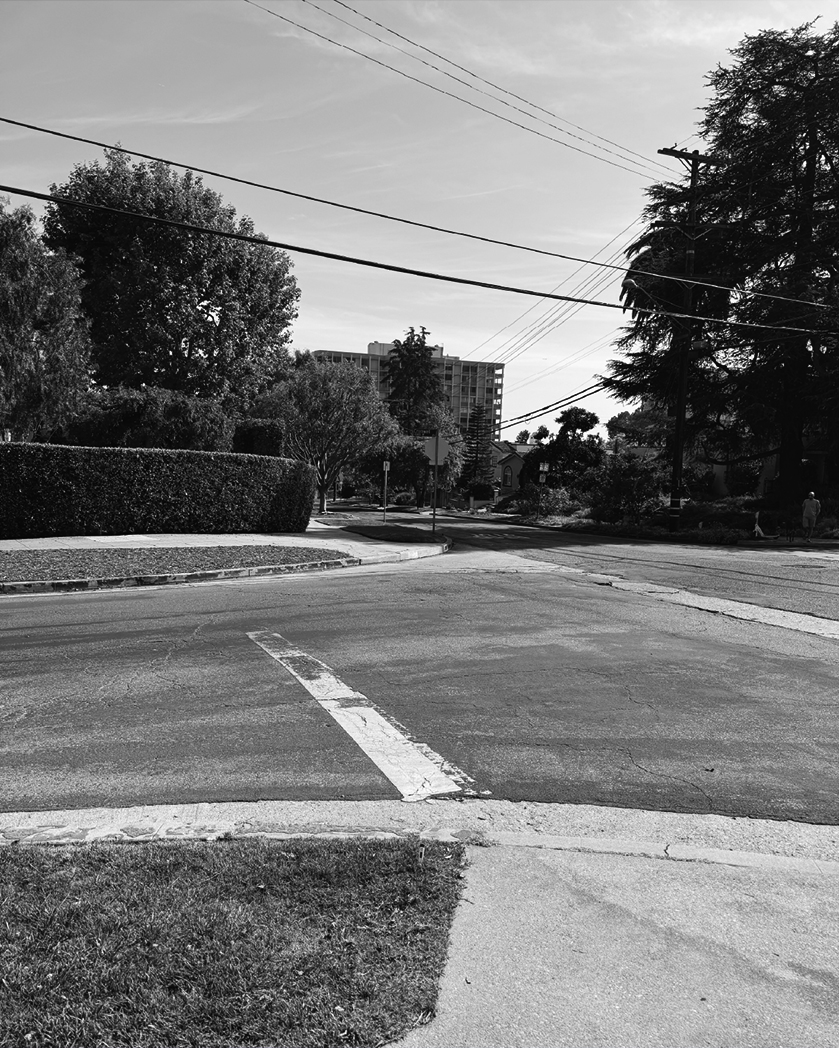
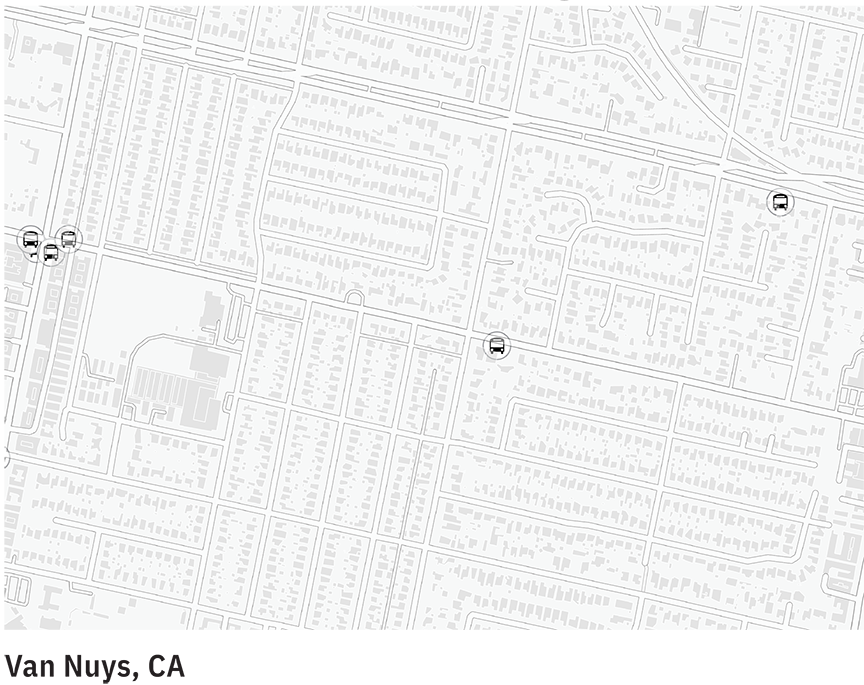
The area includes several bus stops already so the transformation of bus stops into tool sheds will be easier both for reusing the existing stop and knowing the best placement for the new sheds. The site also includes both 2 way and 4-way intersections, making it easier to push forward with the removing of the media. The site includes most one-story homes and a middle school which means a lot of open areas receiving lots of sun aiding the Urban Heat Island Effect.
U.H.I.E.
THE FUTURE
10 YEARS IN THE FUTURE
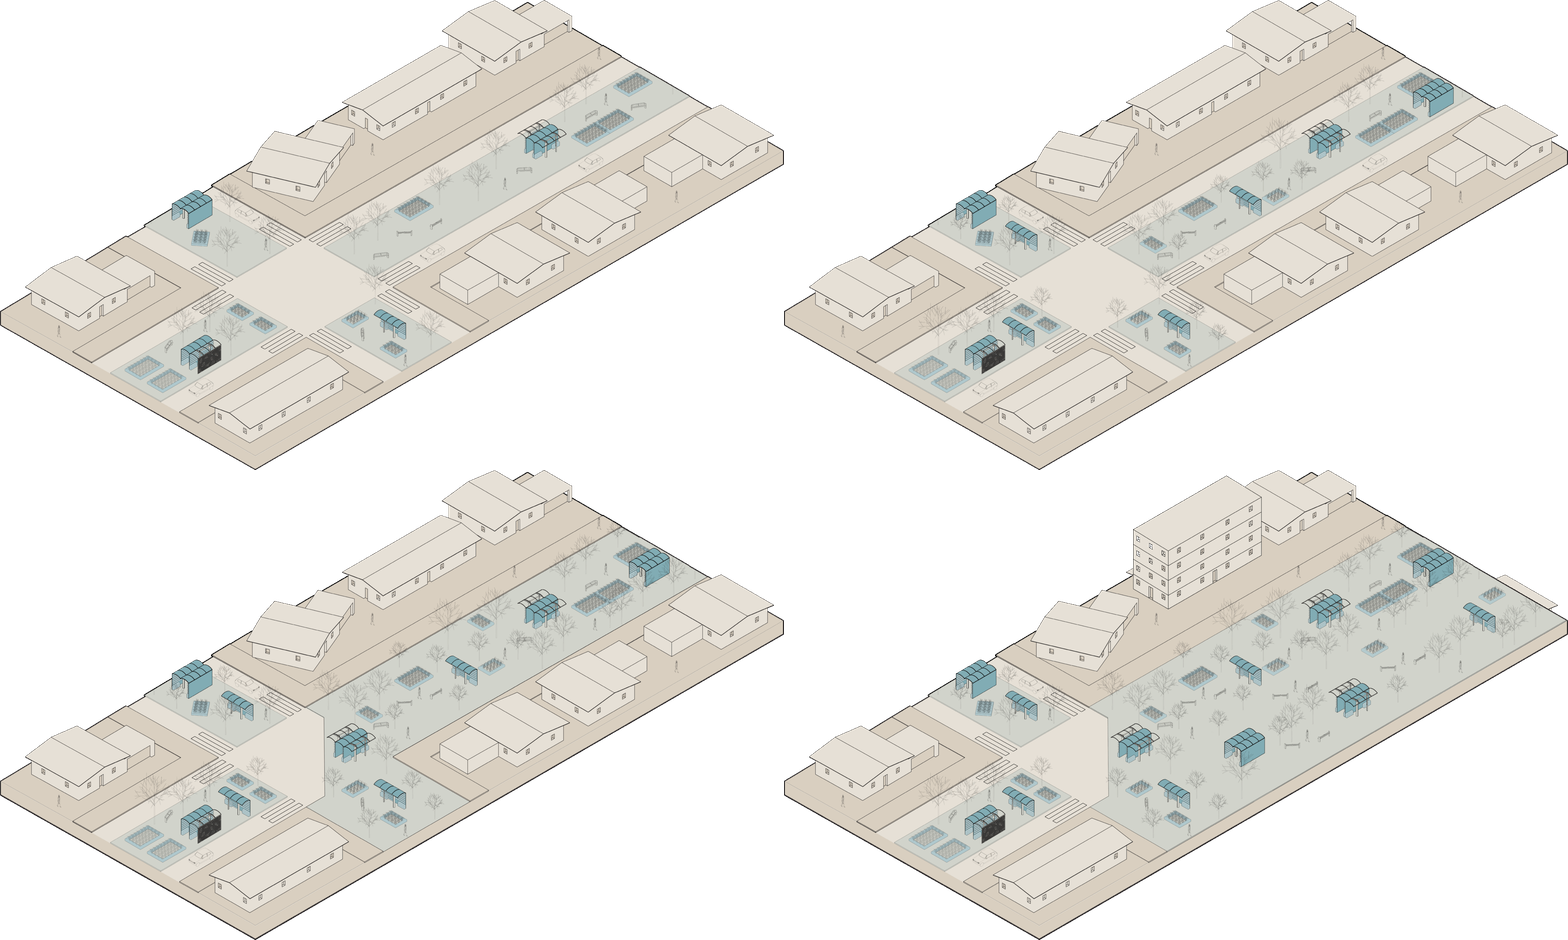
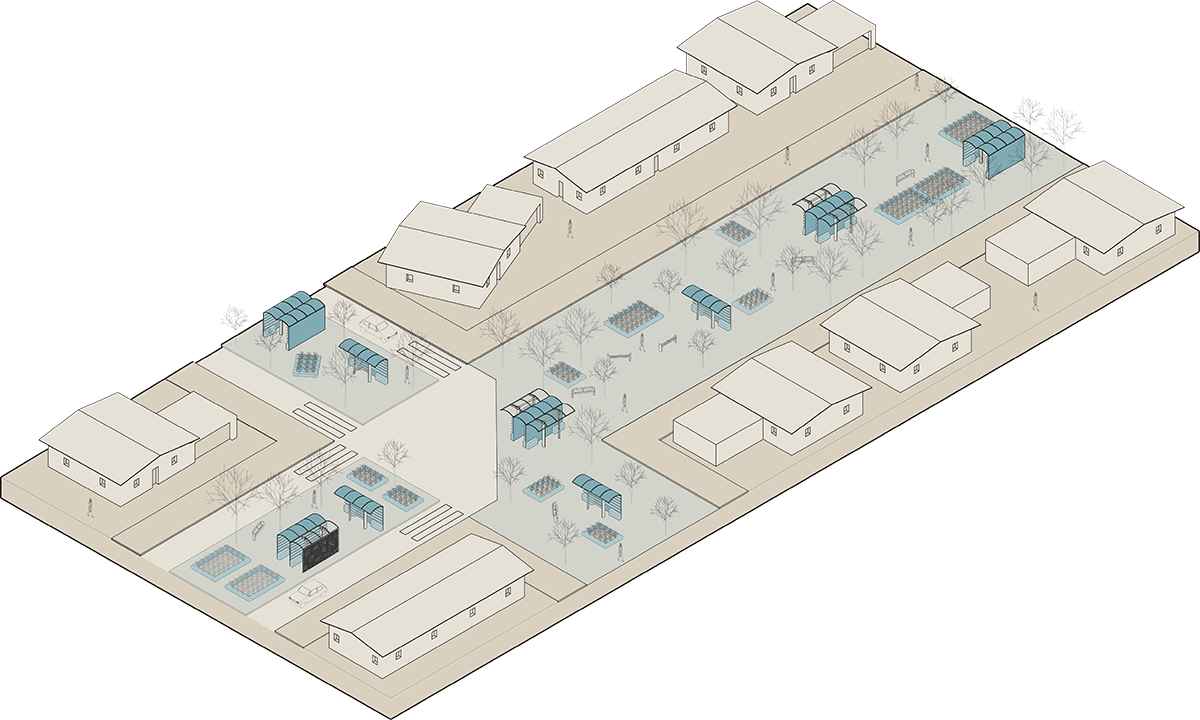
10 years in the future residents would see an increasing the tool sheds. These increases would cause improvements meaning new upgraded sheds would put out still keeping the same purpose of encouraging garden growth and creating communal space. With the new additions, residents would have an increase in tools.
20 YEARS IN THE FUTURE
20 years in the future, residents can create their own street grid with the provided tools from the sheds. This would mean the extension of the green media to now blocking the street off to traffic but leaving enough room to still have a 2-way intersection for vehicular access. With this the residents give back to their community not only for fighting the Urban Heat Island Effect but also encouraging pedestrian foot traffic and extending the amount of space for communal gathering.
50 YEARS IN THE FUTURE
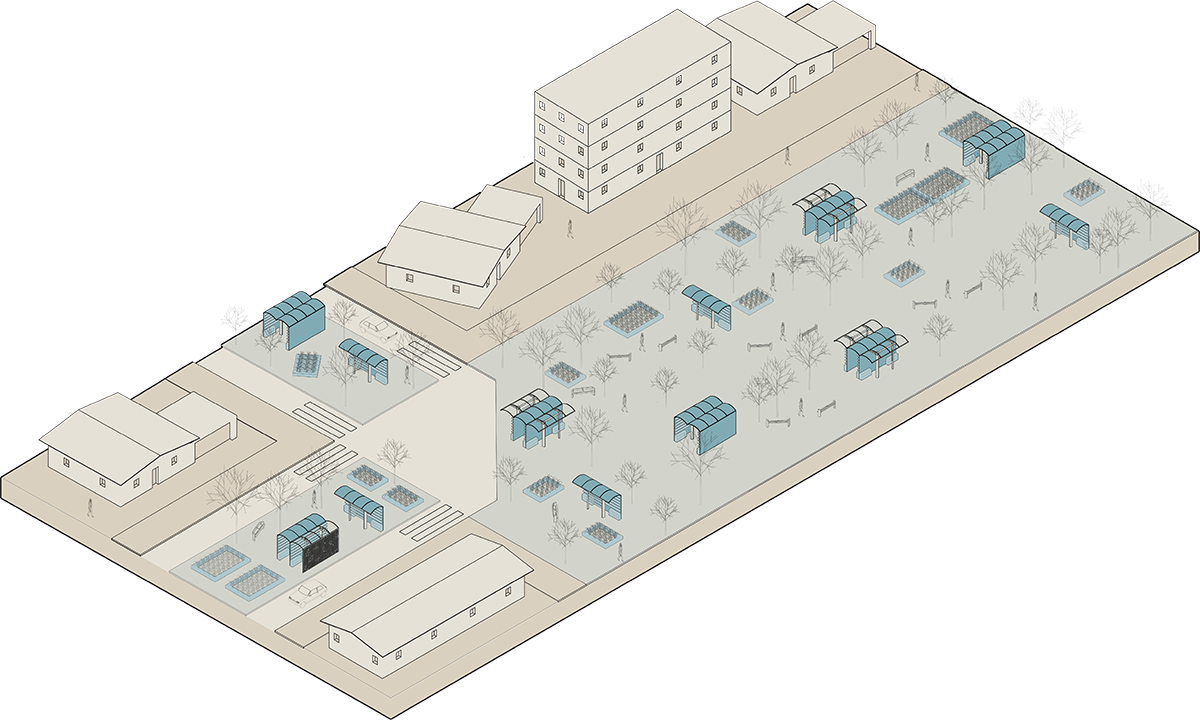
50 years in the future, the entire block will chain as older broken-down houses will be demolished, and in their place will come the extension yet again of the green median. With this massive new expansion, the community would get more sheds built in as the room is there now. More greenery such as trees and plants would be planted. Benches would be all over encouraging lifestyles of outside activities rather than inside. Each neighborhood would have their own small park like area all while fighting the heat island effect and socializing with their fellow residents.
U.H.I.E.
CHOSEN SITE #2
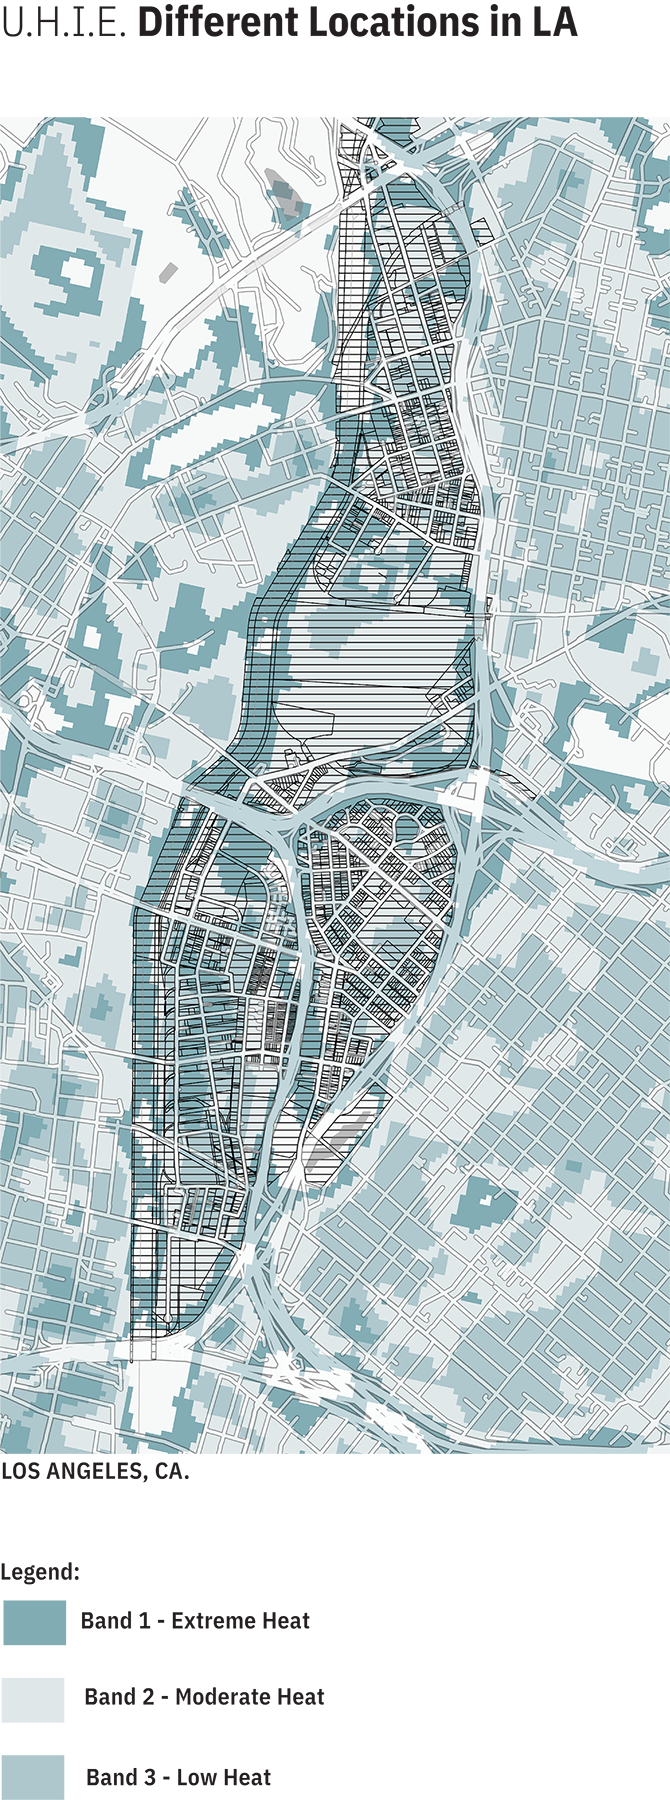
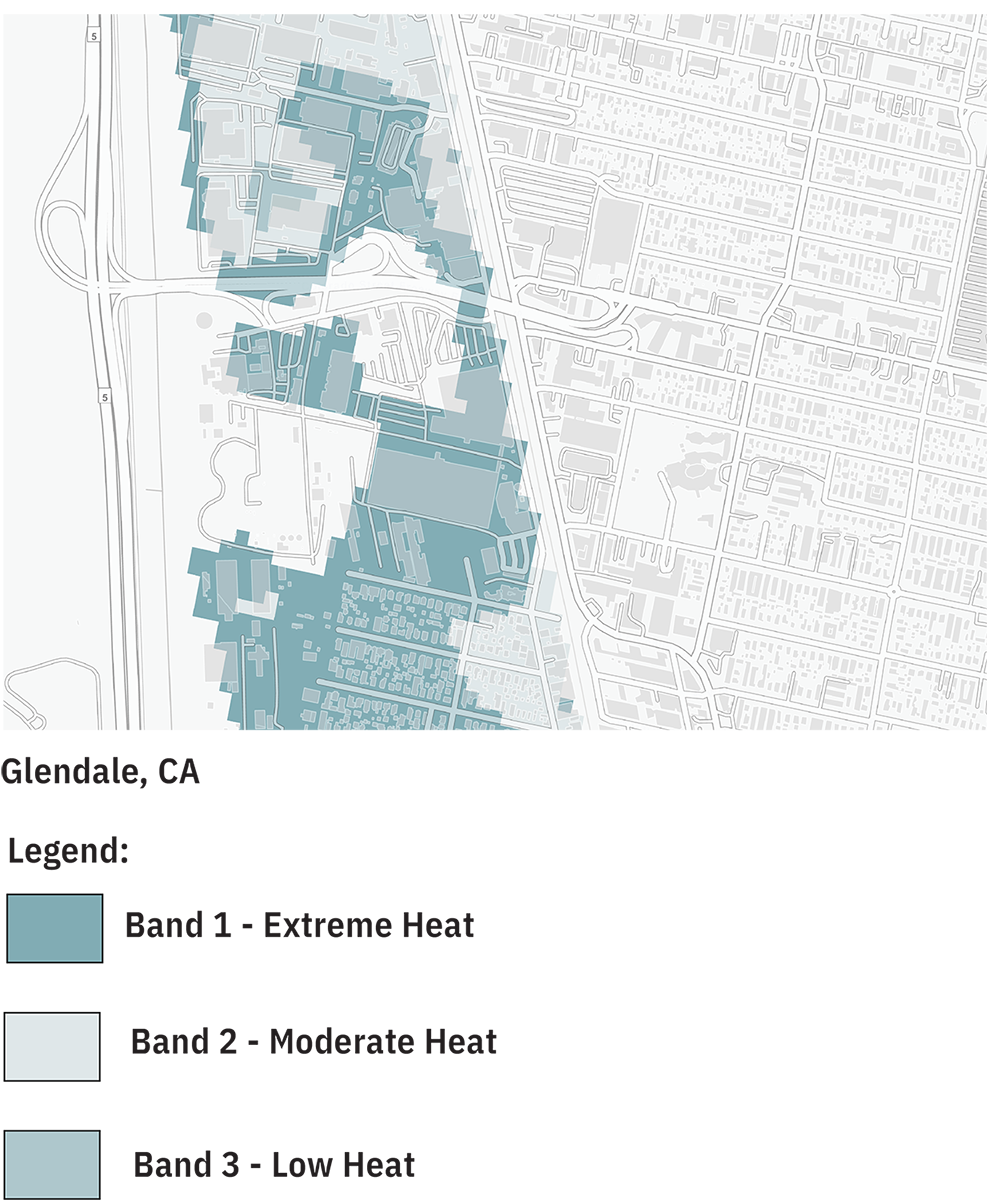
U.H.I.E Bands
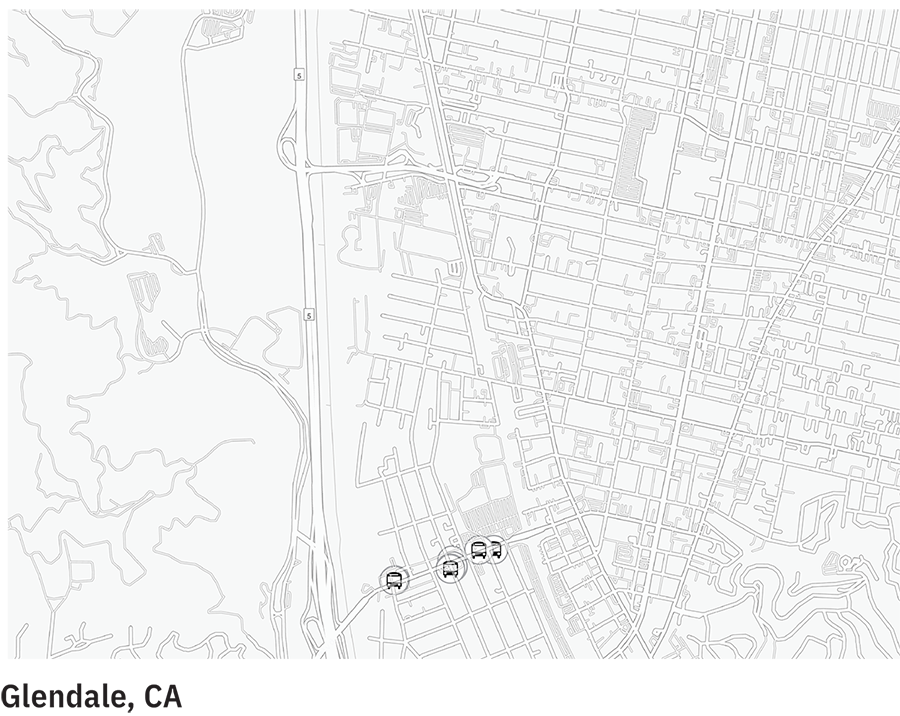
The map shows how a section of Glendale is affected heavily by the Urban Heat Island Effect as the city is in Band 1 and Band 2.
Potential Based on Existing Features
Although the area does not include many bus stops, there are still some nearby the site, so the shed ideas are still in order. The site also includes both 2 way and 4-way intersections, making it easier to push forward with the removing of the media. Site includes a majority of one-story homes and a middle school which means a lot of open areas receiving lots of sun aiding the Urban Heat Island Effect.
Initial Location Where to Start
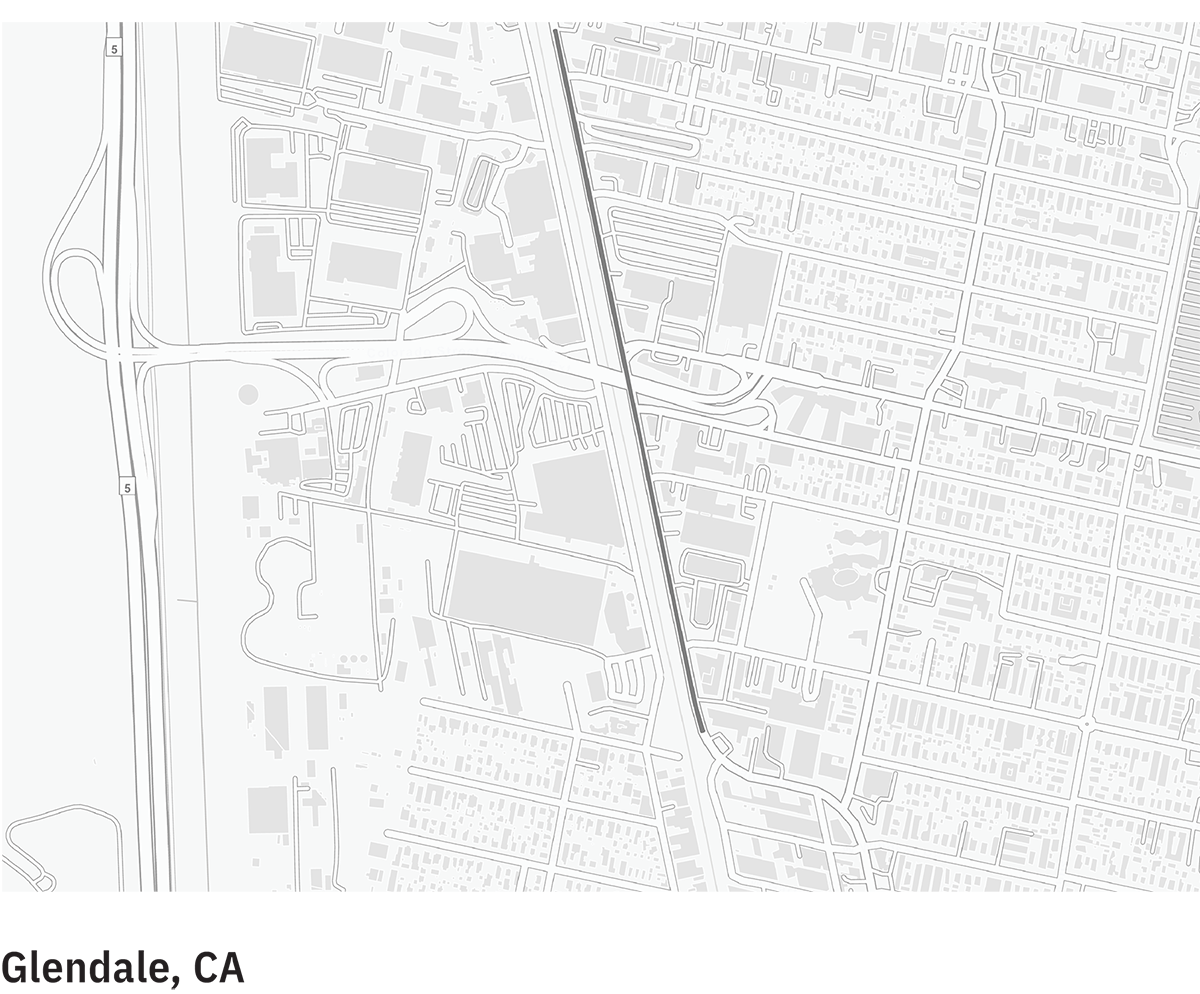
Dark line represents the neighborhood where the construction of the design can start in Glendale. Due to size and length the construction of the design could easily take place as it is surrounded by residents, industrial companies, long roads, and multiway intersections.
U.H.I.E.
THE FUTURE
20 YEARS IN THE FUTURE
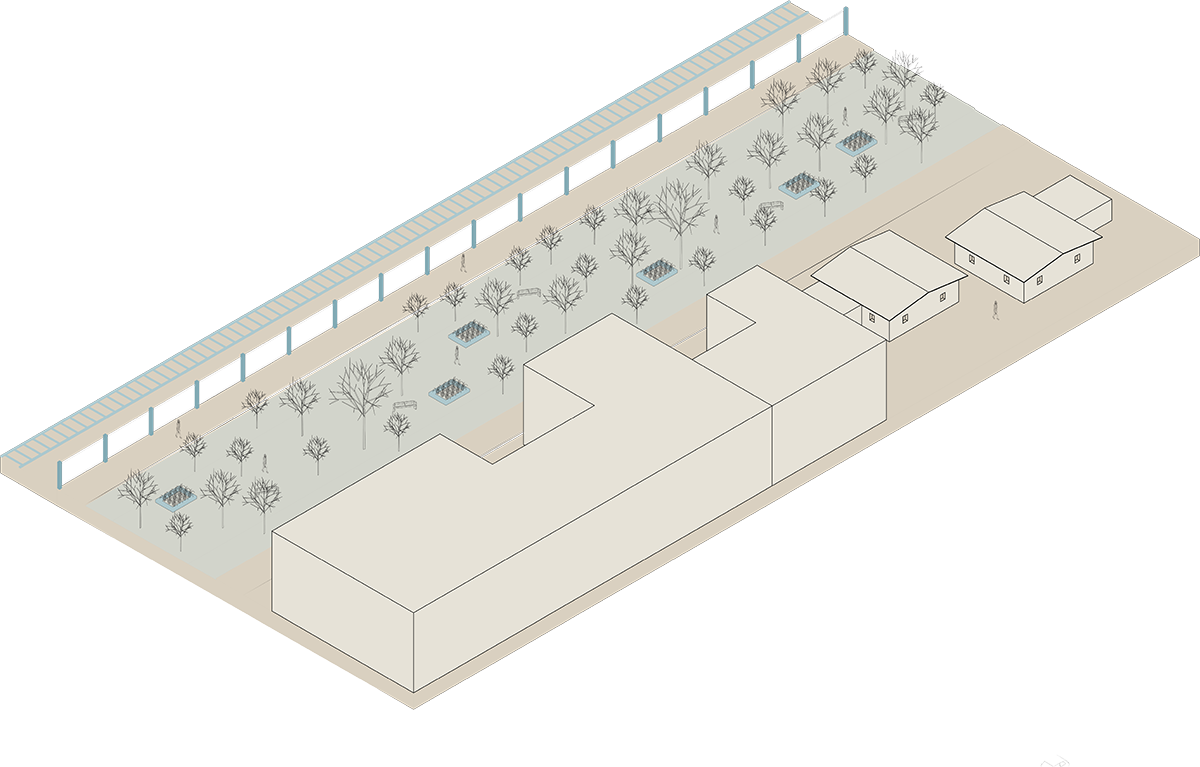
20 years in the future, the green median would expand, taking away both sides of vehicular access that was left and eventually pushing in the space where the old offices or factories were located. This again would allow the increase of greenery such as plants and trees.
50 YEARS IN THE FUTURE
50 years in the future, all the old and worn-out buildings which hosted the factory and office employees will be torn down. This would allow for yet another expansion of the green media now being the entire street of the block where it started. Once more, plants and trees would be planted again, leading to what is now seen as a park providing shade and fighting the urban heat island effect and making room for the extension of residential buildings.
Sources
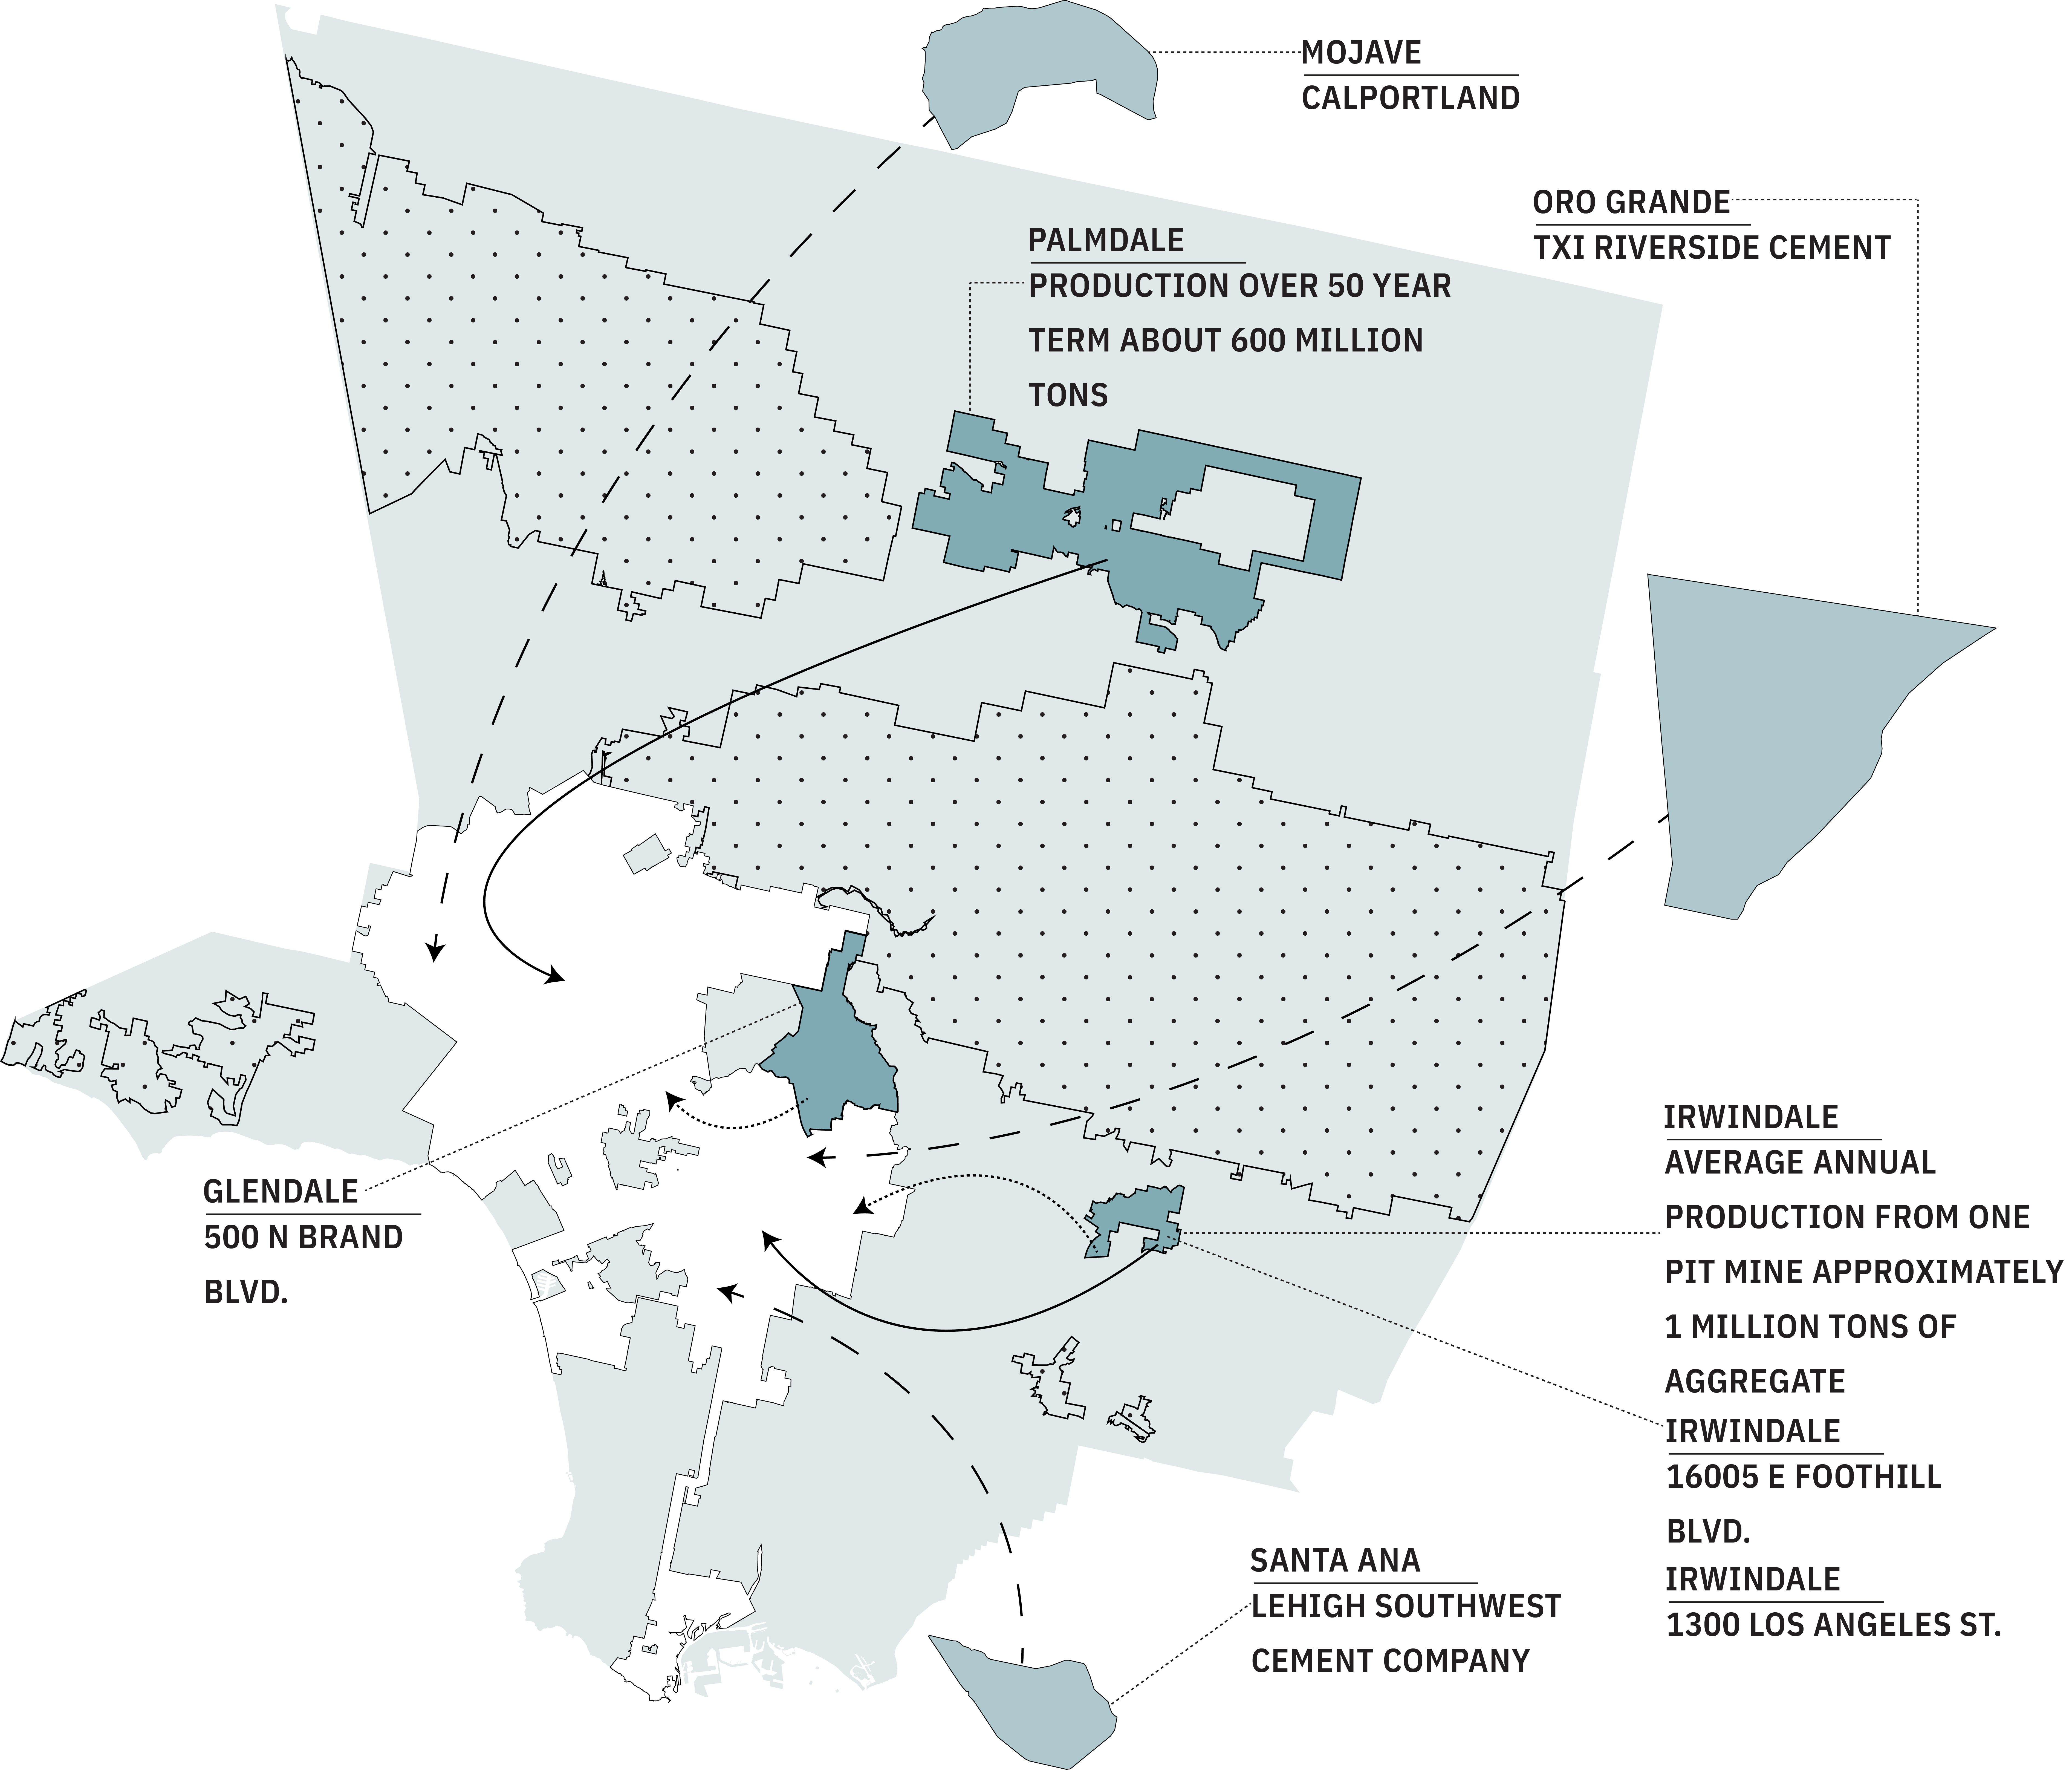
- PBS SoCal, Irwindale: Mining the Building Blocks of Los Angeles, Lost LA, accessed April 15, 2025, https://www.pbssocal.org/shows/lost-la/irwindale-mining-the-building-blocks-of-los-angeles.
- Urban LA, “Overview,” accessed April 15, 2025, https://urbanla.weebly.com/overview.html.
- PBS SoCal, The Origin Story of L.A.’s Numbered Avenues, Lost LA, accessed April 15, 2025, https://www.pbssocal.org/shows/lost-la/the-origin-story-of-l-a-s-numbered-avenues.
- PBS SoCal, Why L.A. Has Clashing Street Grids, Lost LA, accessed April 15, 2025, https://www.pbssocal.org/shows/lost-la/why-l-a-has-clashing-street-grids.
- UrbanRail.net, “Los Angeles,” accessed April 15, 2025, https://www.urbanrail.net/am/lsan/los-angeles.htm.
- Infrastructure USA, Measure M: Lessons from a Successful Transportation Ballot Campaign, accessed April 15, 2025, https://infrastructureusa.org/measure-m-lessons-from-a-successful-transportation-ballot-campaign/.
- Ballotpedia, Los Angeles County Sales Tax, Measure R (November 2008), accessed April 15, 2025, https://ballotpedia.org/Los_Angeles_County_Sales_Tax%2C_Measure_R_%28November_2008%29.
- Los Angeles County, LA County Boundary, accessed April 15, 2025, https://data.lacounty.gov/datasets/la-county-boundary-7/explore?location=34.204505%2C-118.026450%2C8.22
- Los Angeles County, City Boundaries Lines, accessed April 15, 2025, https://data.lacounty.gov/datasets/lacounty::city-boundaries-lines/explore?location=34.113193%2C-117.938852%2C8.91.
- City of Irwindale, Chapter 3.5: Geology, Soils and Mineral Resources, accessed April 15, 2025, https://www.irwindaleca.gov/DocumentCenter/View/997/CHAPTER-35-GEOLOGY-SOILS-AND-MINERAL-RESOURCES.
- California Geological Survey, Aggregate Availability in California, accessed April 15, 2025, https://static1.squarespace.com/static/555e48cfe4b0b5279fec3af3/t/56fd64b127d4bd9cf4587ec8/1459446962745/Aggregate-Availability-in-California.pdf.
- Esri, Map Layer: California Geologic Map, accessed April 15, 2025, https://www.arcgis.com/home/item.html?id=4f6d72903c9741a6a6ee6349f5393572.
- Joe Rubin, “What You Need to Know About LA’s Urban Heat Problem,” Center for Health Journalism, accessed April 15, 2025, https://centerforhealthjournalism.org/our-work/reporting/what-you-need-know-about-las-urban-heat-problem
- Joe Rubin, “Being Outside Can Be Dangerous — Especially at School,” Center for Health Journalism, accessed April 15, 2025, https://centerforhealthjournalism.org/our-work/reporting/being-outside-can-be-dangerous-especially-school.
- U.S. Environmental Protection Agency, What Are Heat
- Islands?, last modified December 20, 2023, https://www.epa.gov/heatislands/what-are-heat-islands.
- Clare Taylor, “It’s Getting Hot in Here: Climate-Resilient
- Infrastructure to Combat the Urban Heat Island Effect,”
- Cleantech Group, July 26, 2022, https://www.cleantech.com/its-getting-hot-in-here-climate-resilient-infrastructure-to-combat-urban-heat-island-effect/.
- Los Angeles Almanac, Public Transportation Usage in Los Angeles County, accessed April 15, 2025, https://www.laalmanac.com/transport/tr01.php.
- Shaped by Concrete. “Learn the Difference Between Cement and Concrete.” Accessed April 25, 2025. https://www.shapedbyconcrete.com/concrete-shaping-our-world/learn-the-difference-between-cement-and-concrete/.
- StreetsLA, What We Do, City of Los Angeles Department of Public Works, accessed April 15, 2025, https://streetsla.lacity.org/what-we-do.
- Engineering Discoveries, “Components of Road Structure and Method,” Engineering Discoveries, last modified March 2020, https://www.engineeringdiscoveries.net/2020/03/components-of-road-structure-and-method.html.
- AboutCivil.org, “Road Structure Cross Section,” AboutCivil.org, accessed April 15, 2025, https://www.aboutcivil.org/road-structure-cross-section.html.
- City of Los Angeles Bureau of Engineering, Standard Plan S-470-1: Street Median and Island Details, last modified October 21, 2015, https://apps.engineering.lacity.gov/techdocs/stdplans/s-400/S-470-1_20151021_150849.pdf.
- City Plants, City Plants, accessed April 15, 2025, https://www.cityplants.org/.
- A Living Tribute, A Living Tribute, accessed April 15, 2025, https://shop.alivingtribute.org/.
- RMP Global, RMP Global, accessed April 15, 2025, https://rmpglobal.com/?msclkid=82f69f6fc51312002aaef891bea38f9.
- Ron Finley, The Ron Finley Project, accessed April 15, 2025, https://www.ronfinley.com/.

