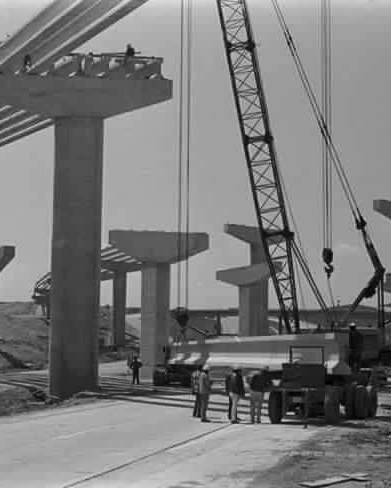
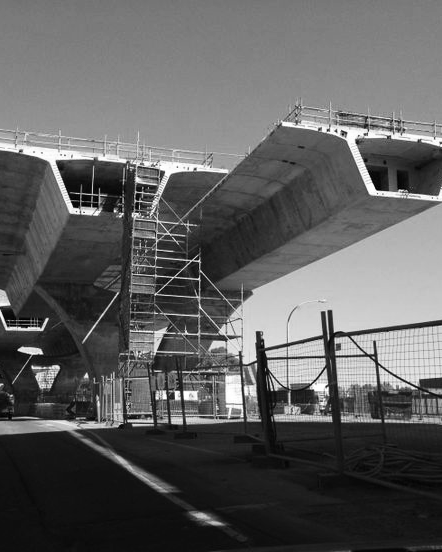
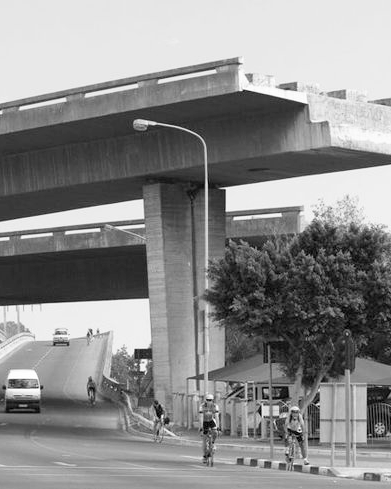
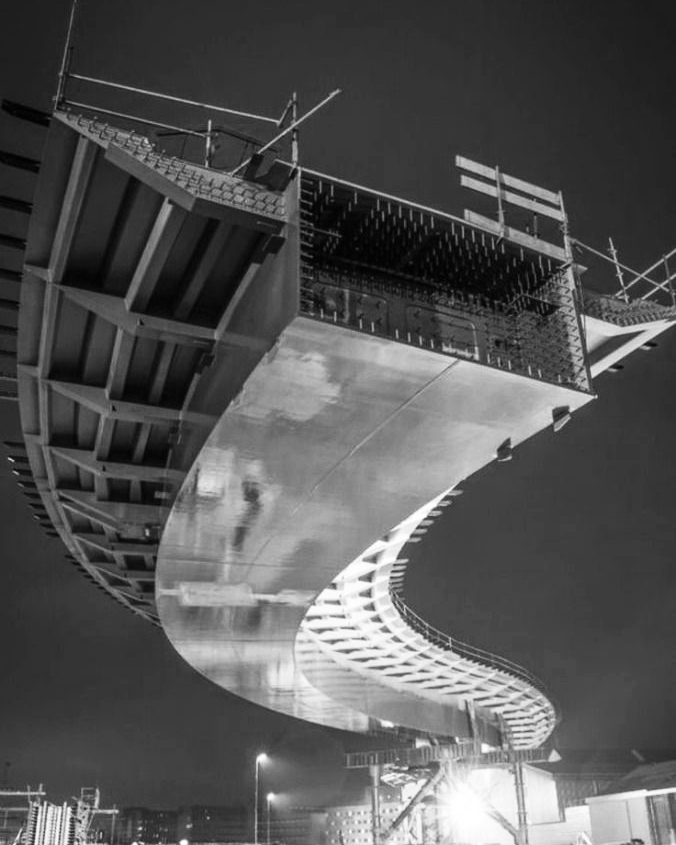
Freeways
“Slow violence is a violence that occurs gradually and out of sight, a violence of delayed destruction that is dispersed across time and space.”
– Rob Nixon
Material quality in Los Angeles freeways is paramount, considering the enormous volume of construction and upkeep. A single mile of freeway, for a 120-foot width and 9-inch thickness, demands roughly 19,360 cubic yards of concrete, which weighs around 77.4 million pounds or 38,720 tons. For the county’s 1,000-mile freeway system, this works out to some 35.6 million tons of concrete. In 50 years, with resurfacing and maintenance, the amount of material used could be as high as 53.4 million to 64.1 million tons. They illustrate how durable, quality materials are needed to handle heavy use and decades.
1920 – 1940
Early Planning & Construction
1924
First freeway proposal in LA’s Major Traffic Street Plan
1934
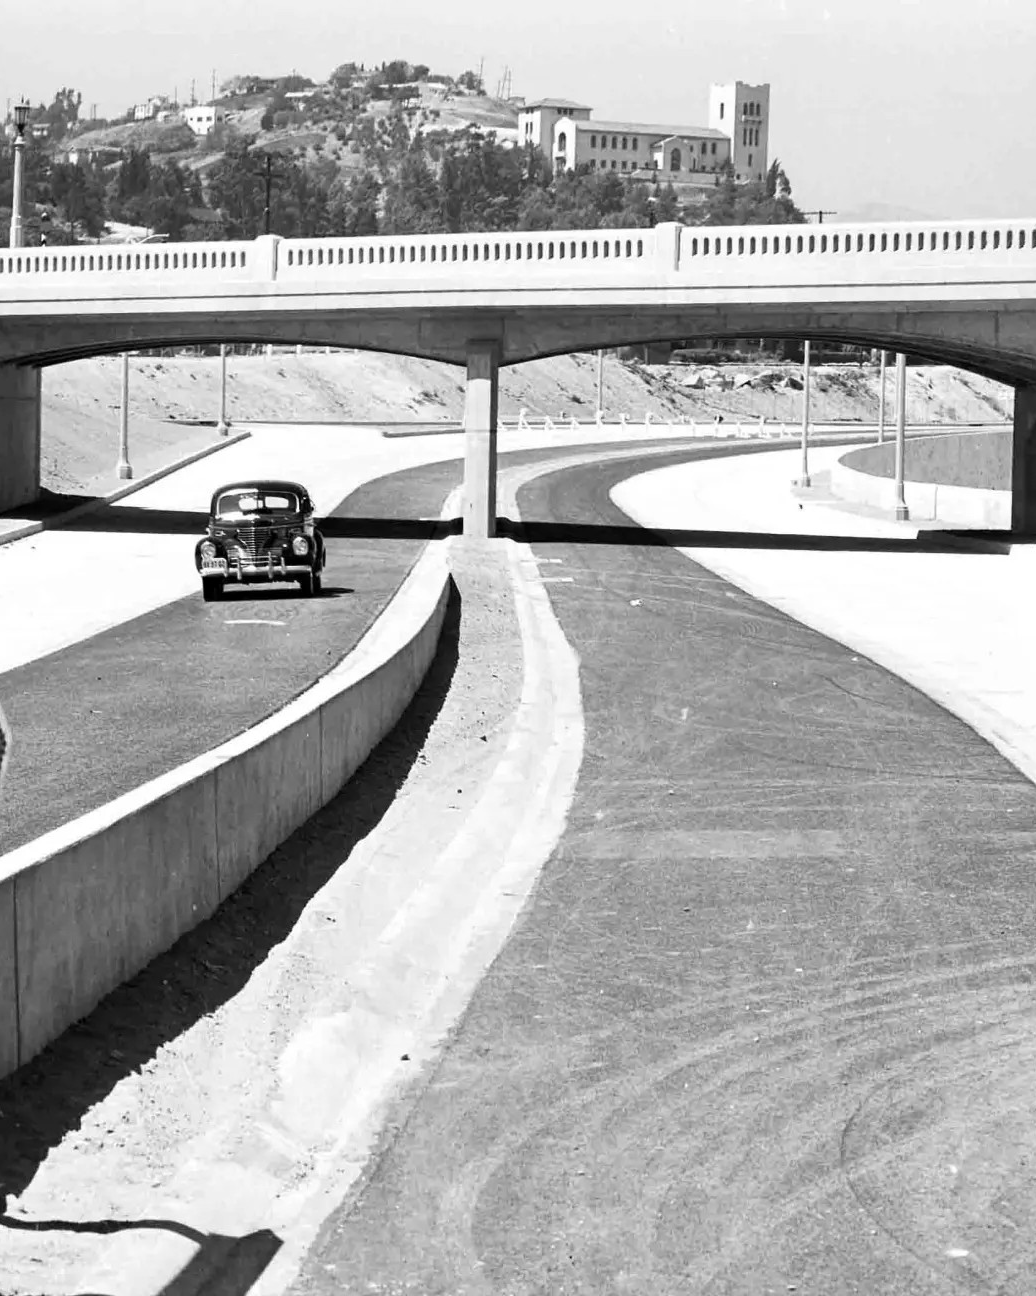
Arroyo Seco Parkway (now Pasadena Freeway) planned as the first U.S. freeway
1940
Arroyo Seco Parkway opens, setting the standard for future freeways
1950 – 1970
Freeway Expansion & Neighborhood Displacement
1950
State and federal funding (Federal-Aid Highway Act of 1956) accelerates freeway construction
1954 – 1965
Construction of major freeways (Harbor Fwy [I-110], Hollywood Fwy [US-101], San Bernardino Fwy [I-10], Santa Monica Fwy [I-10])
1959 – 1965
East LA Interchange completed—one of the world’s busiest freeway interchanges, disrupting Boyle Heights
1960 – 1970
Mass displacement of communities in Boyle Heights, Chavez Ravine, and South LA
1980 – 2000
Environmental & Social Concerns Rise
1980
First air quality regulations introduced due to high vehicle emissions
1990
Studies link freeways to air pollution, asthma, and cardiovascular diseases in nearby neighborhoods
2000
Increased focus on public transit alternatives (Metro Gold Line, Expo Line)
2010 – Present
Rethinking Freeways & Infrastructure
Push for freeway capping projects, noise barriers, and transit-oriented development.
2020
Growing discussions on removing or repurposing freeways in dense urban areas.
Present
Initiatives for zero-emission transportation, congestion pricing, and freeway redesign to reduce environmental and social harm.
INFRASTRUCTURE
WEIGHT
FREEWAY
Concrete Volume & Weight per Mile
Assumptions:
Length: 5,280 ft (1 mile)
Width: 120 ft
Thickness: 0.75 ft (9 inches)
Calculations:
Volume: 5,280 × 120 × 0.75 = 475,200 cubic feet
Convert to cubic yards: 475,200 ÷ 27 = 17,600 cu yd
Add 10% waste: 17,600 × 1.1 = 19,360 cubic yards
Weight (Concrete = 4,000 lbs/cu yd = 2 tons): 19,360 × 4,000 = 77,440,000 lbs
77,440,000 ÷ 2,000 = 38,720 tons
Total Concrete Needed for 1 Mile of Freeway:
19,360 cu yd
77.4 million lbs
38,720 tons
L.A. COUNTY
Weight of Freeway Material
L.A. County has roughly 1,000 miles of freeway.
Each mile = 5,280 ft.
Assuming the average freeway is 120 ft wide and 9 inches thick (0.75 ft):
Volume per mile = 5,280 × 120 × 0.75 = 475,200 cu ft
Across 1,000 miles:
475,200 × 1,000 = 475,200,000 cubic feet total
Convert to cubic yards (since 1 yd³ = 27 ft³):
475,200,000 ÷ 27 = 17,600,000 yd³
Concrete weighs about 150 lbs per cubic foot:
475,200,000 × 150 = 71,280,000,000 lbs
Divide by 2,000 to get tons:
35,640,000 tons
Freeway Material Load in L.A. County
(Embodied + Ongoing Weight)
Existing (Built) Freeway System
Around 1,000 miles of freeway across the county
Avg. width: 120 feet
Thickness: 9 inches (0.75 ft)
Volume per mile: 5,280 ft × 120 ft × 0.75 ft = 475,200 cubic feet
Total volume: 475,200 cu ft × 1,000 miles = 475,200,000 cu ft
Divide by 27 → ≈ 17.6 million cubic yards
FREEWAY
Concrete Volume & Weight per Mile
Assumptions:
Length: 5,280 ft (1 mile)
Width: 120 ft
Thickness: 0.75 ft (9 inches)
Calculations:
Volume: 5,280 × 120 × 0.75 = 475,200 cubic feet
Convert to cubic yards: 475,200 ÷ 27 = 17,600 cu yd
Add 10% waste: 17,600 × 1.1 = 19,360 cubic yards
Weight (Concrete = 4,000 lbs/cu yd = 2 tons): 19,360 × 4,000 = 77,440,000 lbs
77,440,000 ÷ 2,000 = 38,720 tons
Total Concrete Needed for 1 Mile of Freeway:
19,360 cu yd
77.4 million lbs
38,720 tons
L.A. COUNTY
Weight of Freeway Material
L.A. County has roughly 1,000 miles of freeway.
Each mile = 5,280 ft.
Assuming the average freeway is 120 ft wide and 9 inches thick (0.75 ft):
Volume per mile = 5,280 × 120 × 0.75 = 475,200 cu ft
Across 1,000 miles:
475,200 × 1,000 = 475,200,000 cubic feet total
Convert to cubic yards (since 1 yd³ = 27 ft³):
475,200,000 ÷ 27 = 17,600,000 yd³
Concrete weighs about 150 lbs per cubic foot:
475,200,000 × 150 = 71,280,000,000 lbs
Divide by 2,000 to get tons:
35,640,000 tons
L.A. COUNTY
Freeway Material Load
Existing (Built) Freeway System
Around 1,000 miles of freeway across the county
Avg. width: 120 feet
Thickness: 9 inches (0.75 ft)
Volume per mile: 5,280 ft × 120 ft × 0.75 ft = 475,200 cubic feet
Total volume: 475,200 cu ft × 1,000 miles = 475,200,000 cu ft
Divide by 27 → ≈ 17.6 million cubic yards
Weight of existing concrete
475.2 million cu ft × 150 lbs = 71.28 billion lbs
In tons → 71.28B ÷ 2,000 = ≈ 35.6 million tons
Ongoing Material Input (Maintenance + Repairs)
Resurfacing: every 15–25 years
Spot patching: every 5–10 years
Over ~50 years, added material is estimated at 50–80% of the original weight
That’s an additional 17.8M to 28.5M tons
Total Long-Term Material Impact
35.6M tons (original)
17.8M–28.5M tons (maintenance over time)
= Approx. 53.4M to 64.1M tons total
LOS ANGELES
Freeway Maintenance
Caltrans (California Department of Transportation)
Responsible for:
All state freeways and highways (I-5, I-10, I-405, US-101, SR-60, etc.)
Pavement repairs (resurfacing, potholes)
Bridge and structure maintenance
Ramps, interchanges, and freeway connectors
Noise barriers, lighting, drainage systems
Traffic management systems (signals, cameras, sensors)
Graffiti removal and vegetation control
District 7 serves Los Angeles and Ventura Counties, overseeing major freeways and interchanges.
Funded by state and federal gas taxes, bonds, and maintenance programs under SB 1 (The Road Repair and Accountability Act).
STEEL
Employed for reinforcement and structural support, including rebar in concrete and components of bridges and overpasses. The East Los Angeles Interchange incorporated about 13,200,000 pounds of reinforcing and structural steel.
Asphalt
Applied as a top layer on road surfaces to provide a smooth and durable driving experience.
Earth Materials
Excavated and used for embankments and foundational support. Approximately 1,500,000 cubic yards of earth were excavated during the construction of the East Los Angeles Interchange.
Concrete Pipes
Installed for drainage systems to manage water runoff and prevent erosion. The project laid 23,545 feet of concrete pipe.
Aggregate Materials
Such as gravel and crushed stone, used in concrete mixtures and as base layers beneath road surfaces to enhance stability.
FOUR KEY PROBLEMS CAUSED BY FREEWAYS
Auto Dependence
Quantities: Represent vehicle miles traveled (VMT)—for example, LA freeways handle ~300 million VMT per day.
Flows: Use thickness of lines to depict traffic volume and flow intensity.
Sources & Movement: Compare data over decades to show growth in traffic congestion and reliance on cars over time.
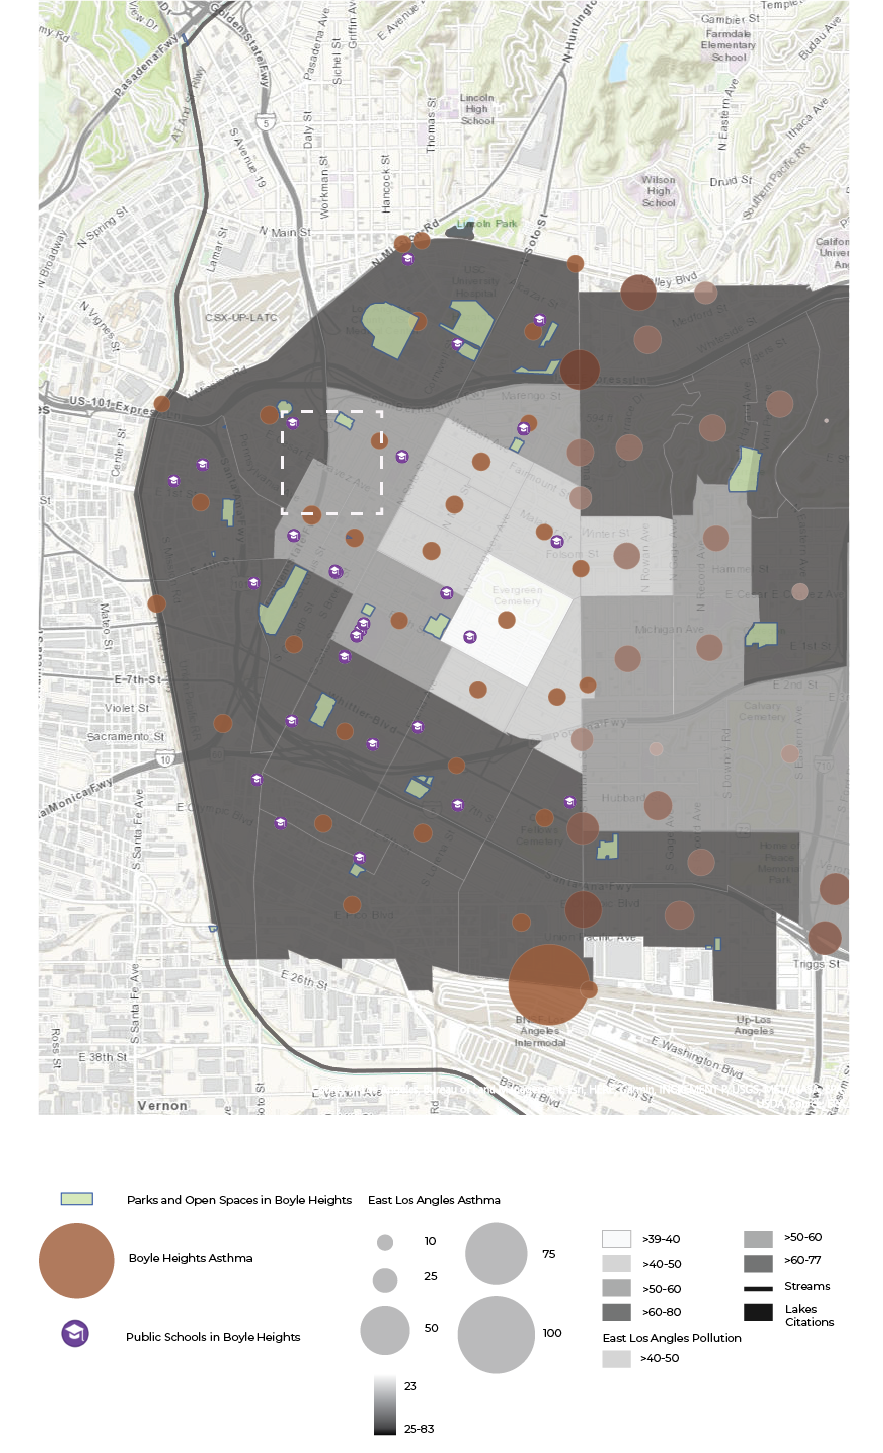
Pollution in Boyle Hights, Los Angeles
Quantities: Measure in PM2.5 (particulate matter) & NOx (nitrogen oxides). Near freeways, PM2.5 can be 20-30 µg/m³, exceeding health guidelines.
Flows: Use arrows and contour lines to show how pollutants drift based on wind direction and freeway layout.
Sources & Movement: Illustrate emissions from cars, trucks, and industrial areas, moving into residential zones and dispersing over time.
Noise Pollution in Boyle Hights, Los Angeles
Quantities: Measure in decibels (dB). Freeways in urban areas often exceed 70-85 dB, impacting nearby communities.
Flows: Indicate noise dissipation with concentric rings or gradient shading showing how intensity decreases with distance.
Sources & Movement: Show how noise spreads outward from high-traffic zones and dissipates into residential areas.
Divided Neighborhoods in Boyle Heights, Los Angeles
Quantities: Map out pedestrian crossings per mile, showing reduced connectivity.
Flows: Indicate restricted movement with broken pathways or blocked access zones.
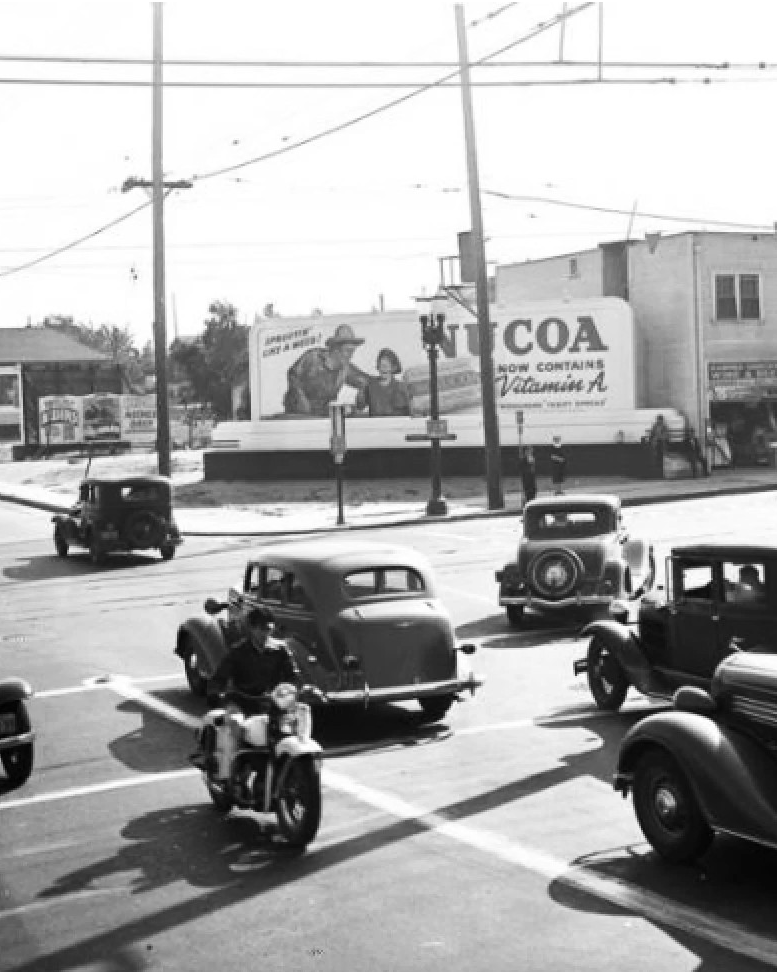
Sources & Movement: Highlight historic changes—before vs. after freeway construction—to show evolving community disconnection.
Earth to Be Excavated (To Place the Freeway Underground)
To build a cut-and-cover trench for the freeway, we excavate the space the road will occupy:
Volume = Length × Width × Depth
3,300 ft × 120 ft × 30 ft = 11,880,000 cubic feet
Convert to cubic yards (27 cu ft = 1 cu yd):
11,880,000 ÷ 27 = ≈ 440,000 cubic yards
Types of Freeways
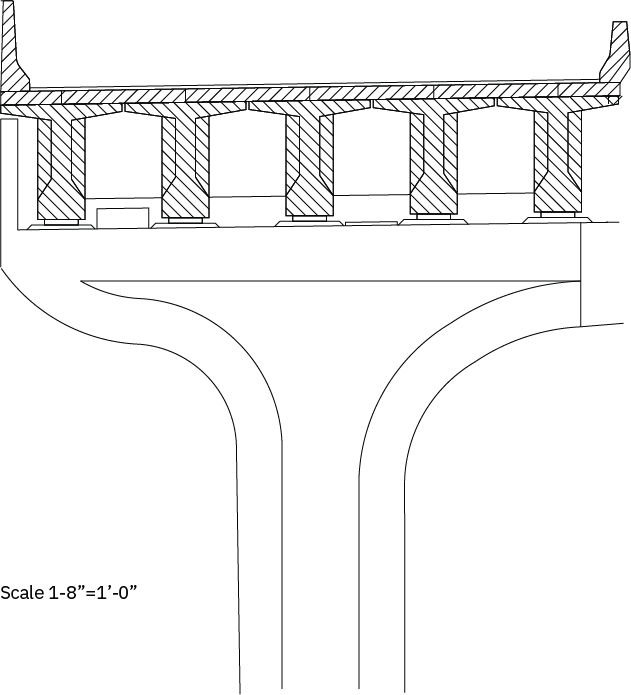
Sunken Freeways + Bridges
Sunken freeways are built below ground level, often with overpasses or bridges crossing above.
Pros: Reduce visual and noise impact; preserve street grid above.
Cons: Expensive drainage systems; can isolate neighborhoods
Tunnels
Freeways go underground through hills or dense areas using tunnels.
Pros: Preserve surface land and minimize disruption.
Cons: High construction and maintenance costs; ventilation and safety are complex.
Sound Walls
Vertical barriers placed alongside freeways to block noise and sometimes visuals.
Pros: Improve quality of life for nearby residents.
Cons: Can be visually unappealing and create a sense of division.
Overpasses and Underpasses
Used to allow roads or pedestrians to cross over or under freeways.
Pros: Maintain traffic flow and connectivity.
Cons: Can be bulky and impact urban aesthetics or pedestrian comfort.
Elevated Freeways
Built above ground on columns, often through urban cores.
Pros: Save ground space; efficient in dense areas.
Cons: Cast shadows, increase noise, and divide communities below.
Sunken Freeways with Caps (Deck Parks)
Sunken roads covered with landscaped “caps” that create usable park space.
Pros: Reconnect neighborhoods; add green space.
Cons: Extremely costly and complex to build and maintain.
Concrete Volume Estimates (Per Mile)
Road surface only (4 lanes + shoulders, 1 ft thick):
5,280 ft × 60 ft × 1 ft = 316,800 cu ft
316,800 ÷ 27 = ≈ 11,733 cubic yards of concrete per mile
Full tunnel structure (walls, base slab, roof slab):
Est. range: 40,000–60,000 cubic yards of concrete per mile
Freeway Proposals
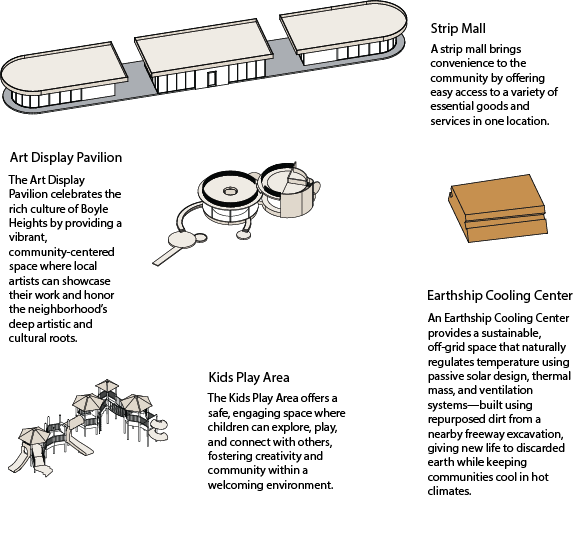
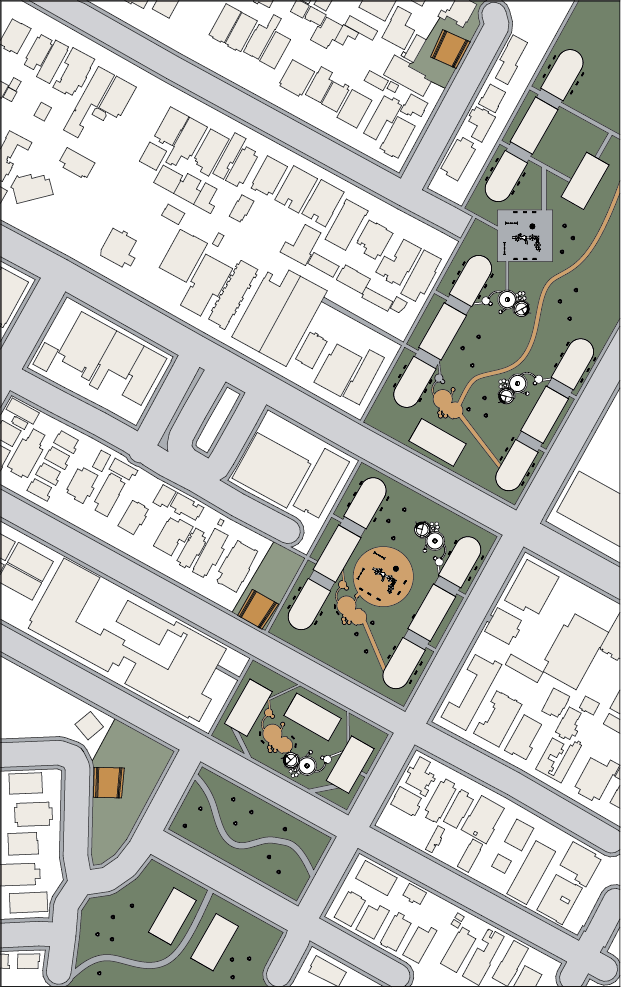
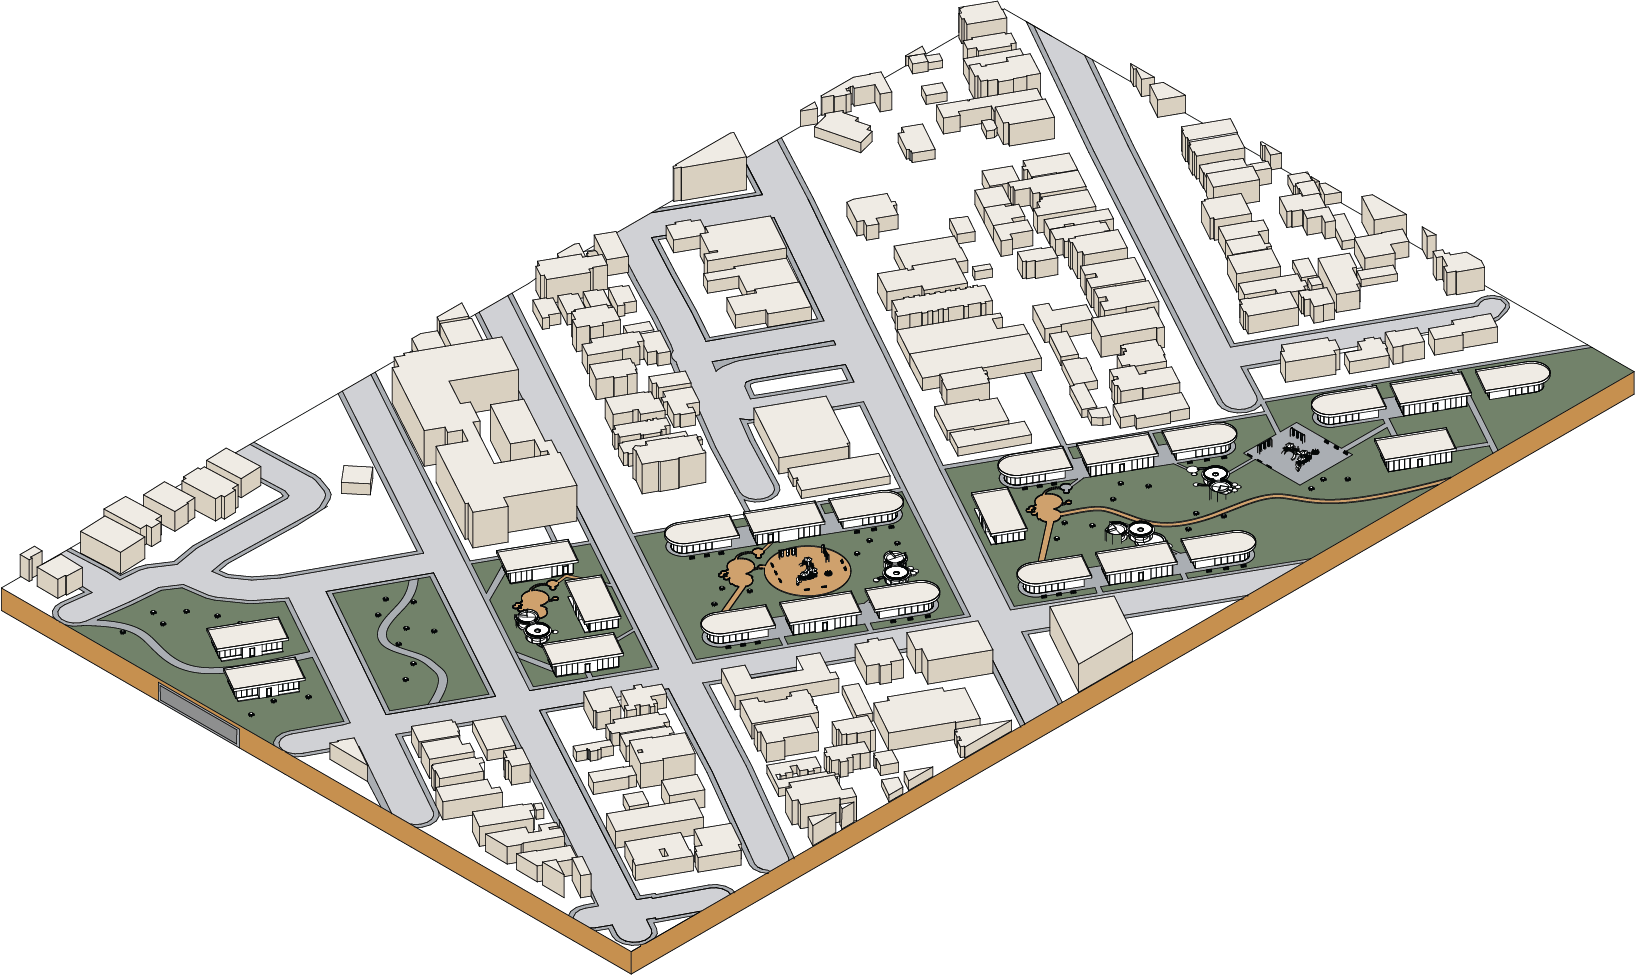
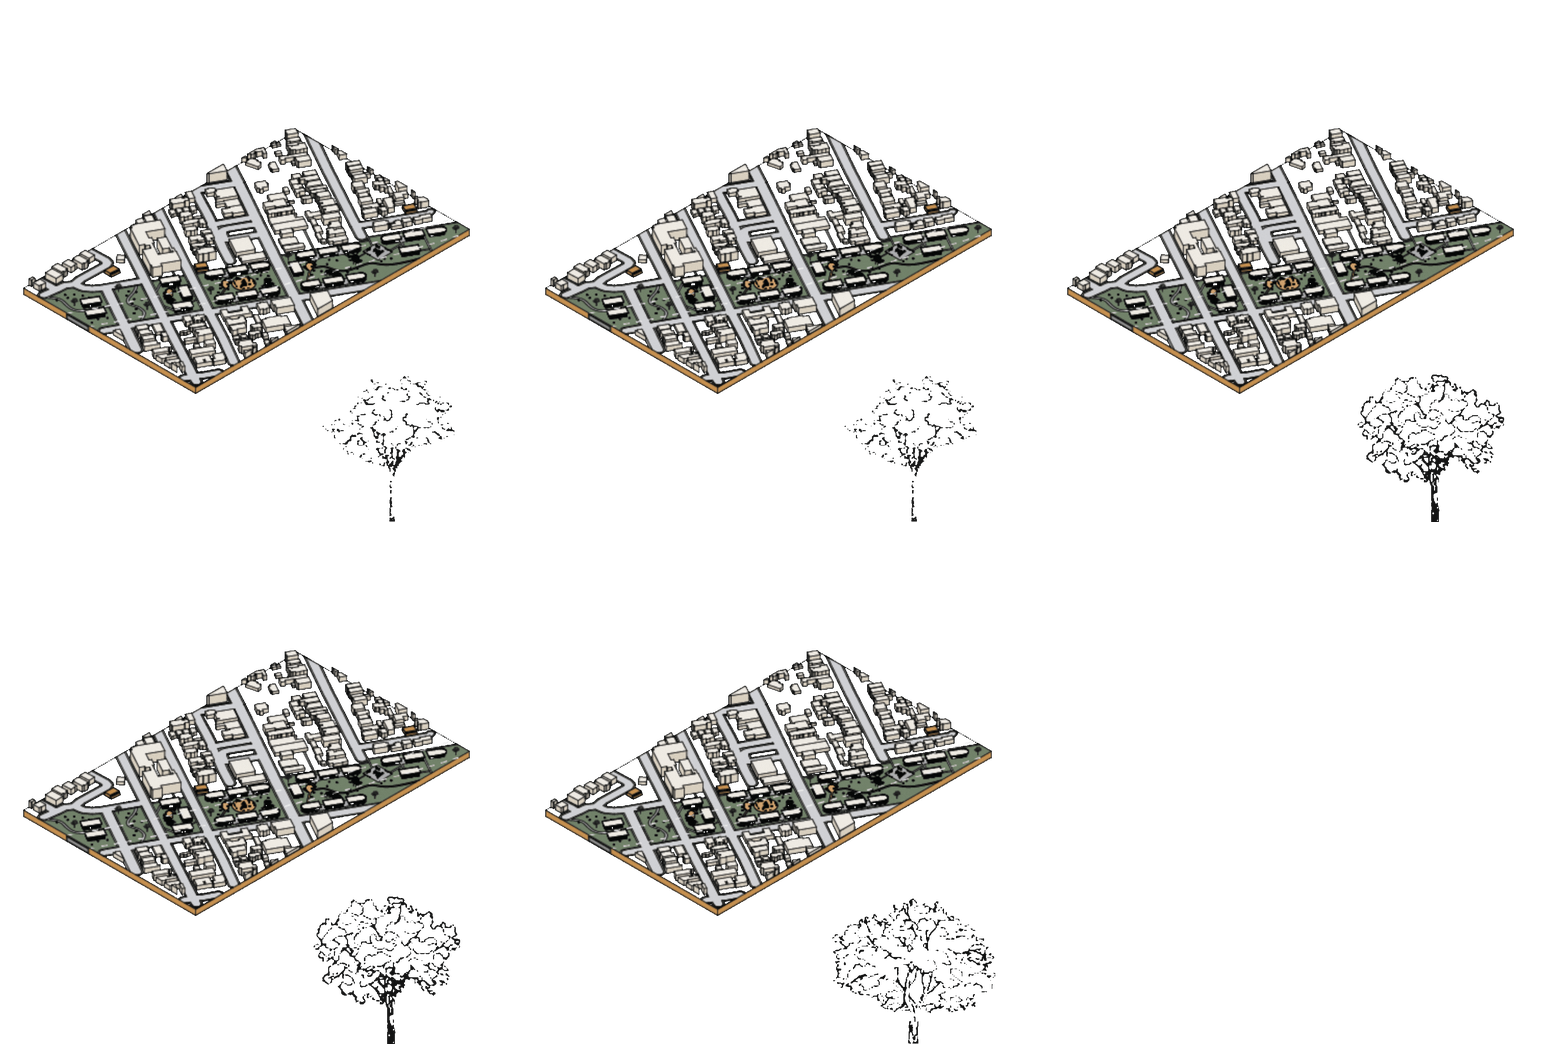
The Art Display Pavilion celebrates the rich culture of Boyle Heights by providing a vibrant, community-centered space where local artists can showcase their work and honor the neighborhood’s deep artistic and cultural roots.
The Kids Play Area offers a safe, engaging space where children can explore, play, and connect with others, fostering creativity and community within a welcoming environment.
An Earthship Cooling Center provides a sustainable, off-grid space that naturally regulates temperature using passive solar design, thermal mass, and ventilation systems—built using repurposed dirt from a nearby freeway excavation, giving new life to discarded earth while keeping communities cool in hot climates.
A strip mall brings convenience to the community by offering easy access to a variety of essential goods and services in one location.
Estimating the Volume of Earth to Be Removed (Above the Freeway)
Assuming the project spans 5 city blocks:
Average length of 1 city block in Los Angeles: approximately 660 feet
Total length: 5 blocks × 660 feet = 3,300 feet
Estimated width of the freeway including shoulders: 120 feet
Estimated excavation depth: 30 feet
Volume calculation:
Length × Width × Depth = 3,300 ft × 120 ft × 30 ft = 11,880,000 cubic feet
Convert to cubic yards (1 cubic yard = 27 cubic feet):
11,880,000 ÷ 27 = approximately 440,000 cubic yards
Additional Excavation for Tunnel Construction
To accommodate the tunnel and clearance requirements:
Length: 3,300 feet
Width of tunnel area: 80 feet
Depth of excavation for tunnel: 50 feet
Volume calculation:
3,300 ft × 80 ft × 50 ft = 13,200,000 cubic feet
13,200,000 ÷ 27 = approximately 488,889 cubic yards
Total Estimated Volume of Earth to Be Removed
440,000 cubic yards (surface excavation)
488,889 cubic yards (tunnel excavation)
= Approximately 928,889 cubic yards of earth
Sources
- Esri. “The 110 Freeway: A Journey Through South LA.” ArcGIS StoryMaps. Accessed April 2025. https://storymaps.arcgis.com/stories/000f9a42160f4ee893128ea78a62a409.
- Esri. “110 Freeway: A Timeline.” ArcGIS StoryMaps. Accessed April 2025. https://storymaps.arcgis.com/stories/3a7a7825bda549a6812d3c11377c0997.
- Esri. “Freeways and Their Impact on South LA.” ArcGIS StoryMaps. Accessed April 2025. https://storymaps.arcgis.com/stories/78922666edfe4e1695a303e5b36acd47.
- Los Angeles County Department of Regional Planning. “Interactive GIS Web Mapping Apps.” LA County Planning. Accessed April 2025. https://planning.lacounty.gov/maps-and-gis/interactive-gis-web-mapping-apps/.
- Government and Technical Reports: 5. U.S. Department of Transportation. 2017 National Highway Construction Cost Index (NHCCI). Washington, DC: Federal Highway Administration. Accessed April 2025. https://www.fhwa.dot.gov/policyinformation/nhcci/pt1.cfm.
- Caltrans. Typical Roadway Cross Sections. California Department of Transportation. Accessed April 2025. https://www.dot.ca.gov/hq/oppd/hdm/pdf/english/chp0300.pdf.
- Los Angeles County Public Works. LA County Roads Maintenance Plan. Accessed April 2025. https://dpw.lacounty.gov.
- Caltrans District 7. Caltrans Near Me – District 7. California Department of Transportation. Accessed April 2025. https://dot.ca.gov/caltrans-near-me/district-7.
- California Transportation Commission. SB 1 Overview. Accessed April 2025. https://catc.ca.gov.
- Caltrans. State Highway Management Plan. California Department of Transportation. Accessed April 2025. https://dot.ca.gov/programs/asset-management.
- Industry & Engineering Sources: 11. Portland Cement Association. “Concrete Materials Properties.” Cement.org. Accessed April 2025. https://www.cement.org.
- Structville. “Weight of Concrete per Cubic Foot, Yard, and Slab.” Structville Civil Engineering. Accessed April 2025. https://www.structville.com.
- Greenbook Committee. Standard Specifications for Public Works Construction. 2021 Edition.


